Delaware vs Immigrants from Latin America Family Poverty

COMPARE

Delaware
Race
Ancestry
AfghanAfricanAlaska NativeAlaskan AthabascanAlbanianAleutAlsatianAmericanApacheArabArapahoArgentineanArmenianAssyrian/Chaldean/SyriacAustralianAustrianBahamianBangladeshiBarbadianBasqueBelgianBelizeanBermudanBhutaneseBlackfeetBolivianBrazilianBritishBritish West IndianBulgarianBurmeseCajunCambodianCanadianCape VerdeanCarpatho RusynCelticCentral AmericanCentral American IndianCherokeeCheyenneChickasawChileanChineseChippewaChoctawColombianColvilleComancheCosta RicanCreeCreekCroatianCrowCubanCypriotCzechCzechoslovakianDanishDelawareDominicanDutchDutch West IndianEastern EuropeanEcuadorianEgyptianEnglishEstonianEthiopianEuropeanFijianFilipinoFinnishFrenchFrench American IndianFrench CanadianGermanGerman RussianGhanaianGreekGuamanian/ChamorroGuatemalanGuyaneseHaitianHmongHonduranHopiHoumaHungarianIcelanderIndian (Asian)IndonesianInupiatIranianIraqiIrishIroquoisIsraeliItalianJamaicanJapaneseJordanianKenyanKiowaKoreanLaotianLatvianLebaneseLiberianLithuanianLumbeeLuxembourgerMacedonianMalaysianMalteseMarshalleseMenomineeMexicanMexican American IndianMongolianMoroccanNative HawaiianNavajoNepaleseNew ZealanderNicaraguanNigerianNorthern EuropeanNorwegianOkinawanOsageOttawaPaiutePakistaniPalestinianPanamanianParaguayanPennsylvania GermanPeruvianPimaPolishPortuguesePotawatomiPuebloPuerto RicanPuget Sound SalishRomanianRussianSalvadoranSamoanScandinavianScotch-IrishScottishSeminoleSenegaleseSerbianShoshoneSierra LeoneanSiouxSlavicSlovakSloveneSomaliSouth AfricanSouth AmericanSouth American IndianSoviet UnionSpaniardSpanishSpanish AmericanSpanish American IndianSri LankanSubsaharan AfricanSudaneseSwedishSwissSyrianTaiwaneseThaiTlingit-HaidaTohono O'OdhamTonganTrinidadian and TobagonianTsimshianTurkishU.S. Virgin IslanderUgandanUkrainianUruguayanUteVenezuelanVietnameseWelshWest IndianYakamaYaquiYugoslavianYumanYup'ikZimbabwean
Immigration
NonimmigrantsImmigrantsAfghanistanAfricaAlbaniaArgentinaArmeniaAsiaAustraliaAustriaBahamasBangladeshBarbadosBelarusBelgiumBelizeBoliviaBosnia and HerzegovinaBrazilBulgariaBurma/MyanmarCabo VerdeCambodiaCameroonCanadaCaribbeanCentral AmericaChileChinaColombiaCongoCosta RicaCroatiaCubaCzechoslovakiaDenmarkDominicaDominican RepublicEastern AfricaEastern AsiaEastern EuropeEcuadorEgyptEl SalvadorEnglandEritreaEthiopiaEuropeFijiFranceGermanyGhanaGreeceGrenadaGuatemalaGuyanaHaitiHondurasHong KongHungaryIndiaIndonesiaIranIraqIrelandIsraelItalyJamaicaJapanJordanKazakhstanKenyaKoreaKuwaitLaosLatviaLebanonLiberiaLithuaniaMalaysiaMexicoMicronesiaMiddle AfricaMoldovaMoroccoNepalNetherlandsNicaraguaNigeriaNorth AmericaNorth MacedoniaNorthern AfricaNorthern EuropeNorwayOceaniaPakistanPanamaPeruPhilippinesPolandPortugalRomaniaRussiaSaudi ArabiaScotlandSenegalSerbiaSierra LeoneSingaporeSomaliaSouth AfricaSouth AmericaSouth Central AsiaSouth Eastern AsiaSouthern EuropeSpainSri LankaSt. Vincent and the GrenadinesSudanSwedenSwitzerlandSyriaTaiwanThailandTrinidad and TobagoTurkeyUgandaUkraineUruguayUzbekistanVenezuelaVietnamWest IndiesWestern AfricaWestern AsiaWestern EuropeYemenZaireZimbabweAzores
Immigrants from Latin America
Race
Ancestry
AfghanAfricanAlaska NativeAlaskan AthabascanAlbanianAleutAlsatianAmericanApacheArabArapahoArgentineanArmenianAssyrian/Chaldean/SyriacAustralianAustrianBahamianBangladeshiBarbadianBasqueBelgianBelizeanBermudanBhutaneseBlackfeetBolivianBrazilianBritishBritish West IndianBulgarianBurmeseCajunCambodianCanadianCape VerdeanCarpatho RusynCelticCentral AmericanCentral American IndianCherokeeCheyenneChickasawChileanChineseChippewaChoctawColombianColvilleComancheCosta RicanCreeCreekCroatianCrowCubanCypriotCzechCzechoslovakianDanishDominicanDutchDutch West IndianEastern EuropeanEcuadorianEgyptianEnglishEstonianEthiopianEuropeanFijianFilipinoFinnishFrenchFrench American IndianFrench CanadianGermanGerman RussianGhanaianGreekGuamanian/ChamorroGuatemalanGuyaneseHaitianHmongHonduranHopiHoumaHungarianIcelanderIndian (Asian)IndonesianInupiatIranianIraqiIrishIroquoisIsraeliItalianJamaicanJapaneseJordanianKenyanKiowaKoreanLaotianLatvianLebaneseLiberianLithuanianLumbeeLuxembourgerMacedonianMalaysianMalteseMarshalleseMenomineeMexicanMexican American IndianMongolianMoroccanNative HawaiianNavajoNepaleseNew ZealanderNicaraguanNigerianNorthern EuropeanNorwegianOkinawanOsageOttawaPaiutePakistaniPalestinianPanamanianParaguayanPennsylvania GermanPeruvianPimaPolishPortuguesePotawatomiPuebloPuerto RicanPuget Sound SalishRomanianRussianSalvadoranSamoanScandinavianScotch-IrishScottishSeminoleSenegaleseSerbianShoshoneSierra LeoneanSiouxSlavicSlovakSloveneSomaliSouth AfricanSouth AmericanSouth American IndianSoviet UnionSpaniardSpanishSpanish AmericanSpanish American IndianSri LankanSubsaharan AfricanSudaneseSwedishSwissSyrianTaiwaneseThaiTlingit-HaidaTohono O'OdhamTonganTrinidadian and TobagonianTsimshianTurkishU.S. Virgin IslanderUgandanUkrainianUruguayanUteVenezuelanVietnameseWelshWest IndianYakamaYaquiYugoslavianYumanYup'ikZimbabwean
Immigration
NonimmigrantsImmigrantsAfghanistanAfricaAlbaniaArgentinaArmeniaAsiaAustraliaAustriaBahamasBangladeshBarbadosBelarusBelgiumBelizeBoliviaBosnia and HerzegovinaBrazilBulgariaBurma/MyanmarCabo VerdeCambodiaCameroonCanadaCaribbeanCentral AmericaChileChinaColombiaCongoCosta RicaCroatiaCubaCzechoslovakiaDenmarkDominicaDominican RepublicEastern AfricaEastern AsiaEastern EuropeEcuadorEgyptEl SalvadorEnglandEritreaEthiopiaEuropeFijiFranceGermanyGhanaGreeceGrenadaGuatemalaGuyanaHaitiHondurasHong KongHungaryIndiaIndonesiaIranIraqIrelandIsraelItalyJamaicaJapanJordanKazakhstanKenyaKoreaKuwaitLaosLatin AmericaLatviaLebanonLiberiaLithuaniaMalaysiaMexicoMicronesiaMiddle AfricaMoldovaMoroccoNepalNetherlandsNicaraguaNigeriaNorth AmericaNorth MacedoniaNorthern AfricaNorthern EuropeNorwayOceaniaPakistanPanamaPeruPhilippinesPolandPortugalRomaniaRussiaSaudi ArabiaScotlandSenegalSerbiaSierra LeoneSingaporeSomaliaSouth AfricaSouth AmericaSouth Central AsiaSouth Eastern AsiaSouthern EuropeSpainSri LankaSt. Vincent and the GrenadinesSudanSwedenSwitzerlandSyriaTaiwanThailandTrinidad and TobagoTurkeyUgandaUkraineUruguayUzbekistanVenezuelaVietnamWest IndiesWestern AfricaWestern AsiaWestern EuropeYemenZaireZimbabweAzores
Family Poverty
Income
Poverty
Unemployment
Labor Participation
Family Structure
Vehicle Availability
Education Level
Disability

Family Poverty Comparison

Delaware

Immigrants from Latin America

Fair
Tragic
9.2%
FAMILY POVERTY
35.4/ 100
METRIC RATING
187th/ 347
METRIC RANK
11.8%
FAMILY POVERTY
0.0/ 100
METRIC RATING
304th/ 347
METRIC RANK

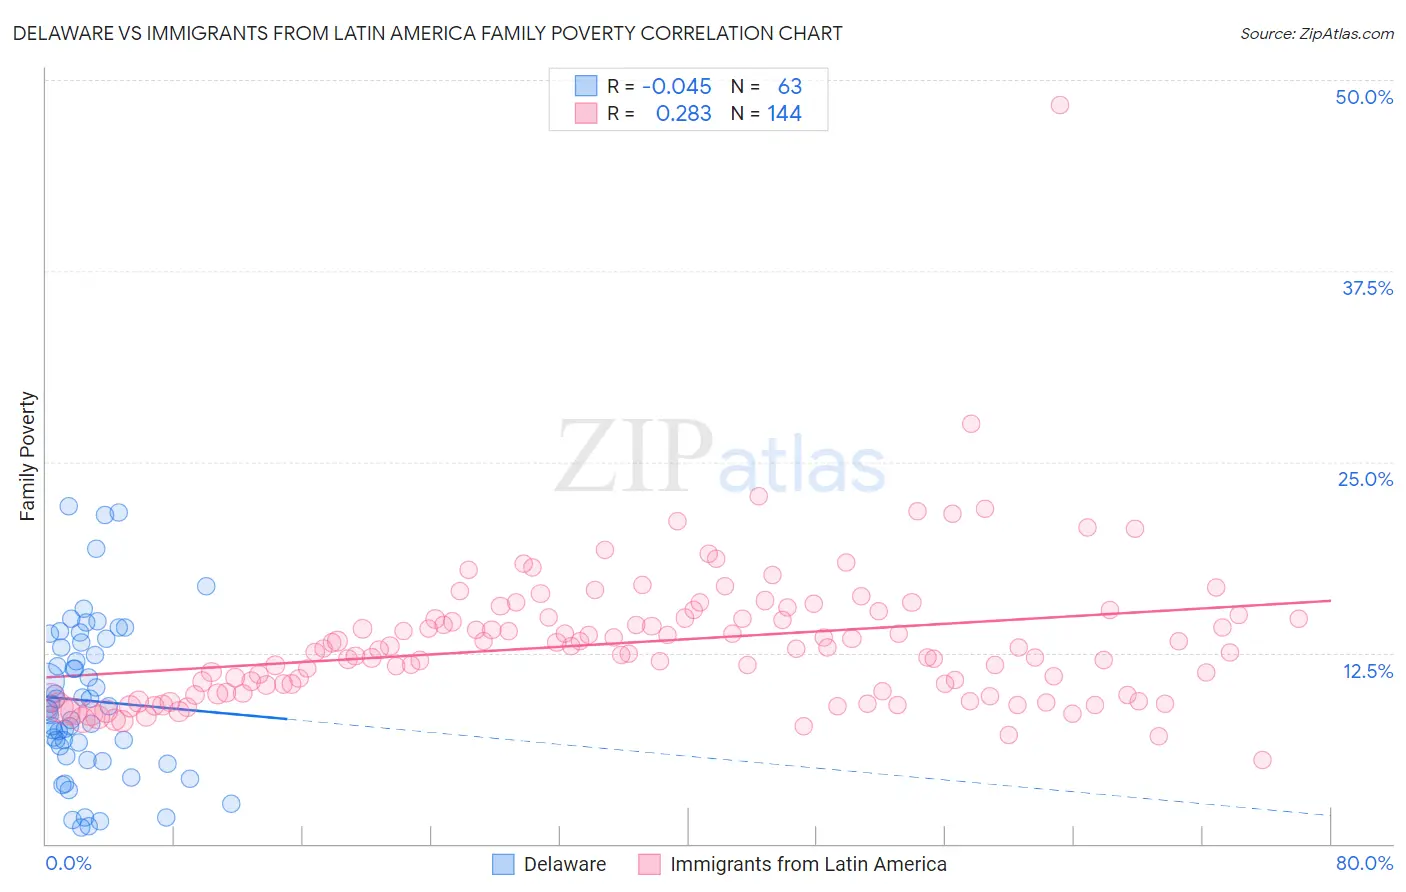
Delaware vs Immigrants from Latin America Family Poverty Correlation Chart

The statistical analysis conducted on geographies consisting of 96,157,993 people shows no correlation between the proportion of Delaware and poverty level among families in the United States with a correlation coefficient (R) of -0.045 and weighted average of 9.2%. Similarly, the statistical analysis conducted on geographies consisting of 554,872,289 people shows a weak positive correlation between the proportion of Immigrants from Latin America and poverty level among families in the United States with a correlation coefficient (R) of 0.283 and weighted average of 11.8%, a difference of 28.5%.
Delaware vs Immigrants from Latin America Family Poverty

Family Poverty Correlation Summary

MeasurementDelawareImmigrants from Latin America
Minimum1.0%5.5%
Maximum22.1%48.4%
Range21.0%42.9%
Mean9.4%13.2%
Median8.8%12.7%
Interquartile 25% (IQ1)5.7%9.8%
Interquartile 75% (IQ3)13.2%14.8%
Interquartile Range (IQR)7.4%5.0%
Standard Deviation (Sample)5.1%4.7%
Standard Deviation (Population)5.1%4.7%

Similar Demographics by Family Poverty

Demographics Similar to Delaware by Family Poverty

In terms of family poverty, the demographic groups most similar to Delaware are Colombian (9.2%, a difference of 0.090%), Immigrants from Kenya (9.2%, a difference of 0.20%), Immigrants from Saudi Arabia (9.1%, a difference of 0.44%), South American Indian (9.1%, a difference of 0.45%), and Immigrants from Afghanistan (9.2%, a difference of 0.48%).
DemographicsRating | RankFamily Poverty
Immigrants | Uganda
43.4
/100
|
#180
Average
9.1%
Hmong
40.2
/100
|
#181
Average
9.1%
Immigrants | Morocco
40.2
/100
|
#182
Average
9.1%
Uruguayans
39.2
/100
|
#183
Fair
9.1%
South American Indians
38.7
/100
|
#184
Fair
9.1%
Immigrants | Saudi Arabia
38.6
/100
|
#185
Fair
9.1%
Colombians
36.1
/100
|
#186
Fair
9.2%
Delaware
35.4
/100
|
#187
Fair
9.2%
Immigrants | Kenya
34.0
/100
|
#188
Fair
9.2%
Immigrants | Afghanistan
32.1
/100
|
#189
Fair
9.2%
Arabs
31.5
/100
|
#190
Fair
9.2%
Ugandans
28.7
/100
|
#191
Fair
9.3%
Spanish
28.7
/100
|
#192
Fair
9.3%
Immigrants | Western Asia
28.2
/100
|
#193
Fair
9.3%
South Americans
28.1
/100
|
#194
Fair
9.3%

Demographics Similar to Immigrants from Latin America by Family Poverty

In terms of family poverty, the demographic groups most similar to Immigrants from Latin America are Mexican (11.8%, a difference of 0.18%), African (11.8%, a difference of 0.19%), Guatemalan (11.7%, a difference of 0.69%), Bahamian (11.7%, a difference of 0.73%), and Cajun (11.9%, a difference of 0.74%).
DemographicsRating | RankFamily Poverty
Creek
0.0
/100
|
#297
Tragic
11.7%
Immigrants | Senegal
0.0
/100
|
#298
Tragic
11.7%
Dutch West Indians
0.0
/100
|
#299
Tragic
11.7%
Immigrants | Bangladesh
0.0
/100
|
#300
Tragic
11.7%
Bahamians
0.0
/100
|
#301
Tragic
11.7%
Guatemalans
0.0
/100
|
#302
Tragic
11.7%
Africans
0.0
/100
|
#303
Tragic
11.8%
Immigrants | Latin America
0.0
/100
|
#304
Tragic
11.8%
Mexicans
0.0
/100
|
#305
Tragic
11.8%
Cajuns
0.0
/100
|
#306
Tragic
11.9%
Immigrants | Congo
0.0
/100
|
#307
Tragic
11.9%
Seminole
0.0
/100
|
#308
Tragic
11.9%
Hispanics or Latinos
0.0
/100
|
#309
Tragic
12.0%
Immigrants | Guatemala
0.0
/100
|
#310
Tragic
12.0%
Ute
0.0
/100
|
#311
Tragic
12.1%