Cypriot vs Liberian Single Father Poverty
COMPARE
Cypriot
Liberian
Single Father Poverty
Single Father Poverty Comparison
Cypriots
Liberians
15.9%
SINGLE FATHER POVERTY
87.5/ 100
METRIC RATING
136th/ 347
METRIC RANK
16.0%
SINGLE FATHER POVERTY
83.3/ 100
METRIC RATING
141st/ 347
METRIC RANK
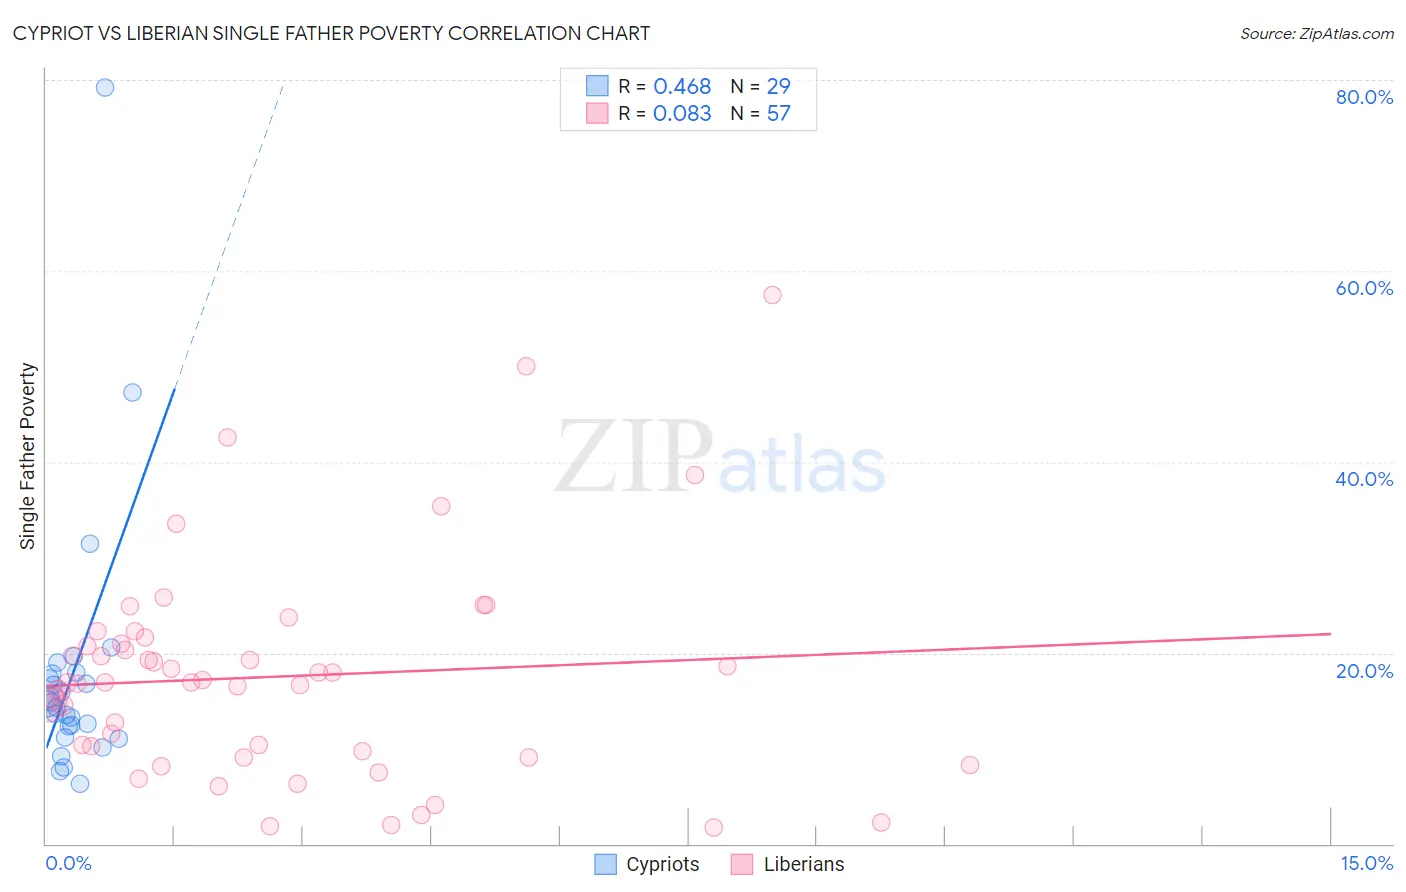
Cypriot vs Liberian Single Father Poverty Correlation Chart
The statistical analysis conducted on geographies consisting of 55,535,084 people shows a moderate positive correlation between the proportion of Cypriots and poverty level among single fathers in the United States with a correlation coefficient (R) of 0.468 and weighted average of 15.9%. Similarly, the statistical analysis conducted on geographies consisting of 107,628,727 people shows a slight positive correlation between the proportion of Liberians and poverty level among single fathers in the United States with a correlation coefficient (R) of 0.083 and weighted average of 16.0%, a difference of 0.38%.
Single Father Poverty Correlation Summary
| Measurement | Cypriot | Liberian |
| Minimum | 6.2% | 1.7% |
| Maximum | 79.2% | 57.4% |
| Range | 72.9% | 55.7% |
| Mean | 17.9% | 17.5% |
| Median | 14.6% | 16.9% |
| Interquartile 25% (IQ1) | 11.7% | 9.4% |
| Interquartile 75% (IQ3) | 17.9% | 21.3% |
| Interquartile Range (IQR) | 6.2% | 11.9% |
| Standard Deviation (Sample) | 14.1% | 11.3% |
| Standard Deviation (Population) | 13.9% | 11.2% |
Demographics Similar to Cypriots and Liberians by Single Father Poverty
In terms of single father poverty, the demographic groups most similar to Cypriots are Immigrants from the Azores (15.9%, a difference of 0.030%), Central American (16.0%, a difference of 0.040%), Immigrants from Sri Lanka (15.9%, a difference of 0.070%), Immigrants from South America (15.9%, a difference of 0.10%), and South American (16.0%, a difference of 0.16%). Similarly, the demographic groups most similar to Liberians are Immigrants from Mexico (16.0%, a difference of 0.0%), Immigrants from Central America (16.0%, a difference of 0.020%), Immigrants from Kuwait (16.0%, a difference of 0.15%), Immigrants from Netherlands (16.0%, a difference of 0.17%), and Immigrants from Western Asia (16.0%, a difference of 0.20%).
| Demographics | Rating | Rank | Single Father Poverty |
| Immigrants | Nigeria | 90.8 /100 | #128 | Exceptional 15.9% |
| Immigrants | West Indies | 90.8 /100 | #129 | Exceptional 15.9% |
| Norwegians | 90.2 /100 | #130 | Exceptional 15.9% |
| Nicaraguans | 90.1 /100 | #131 | Exceptional 15.9% |
| Immigrants | Portugal | 89.7 /100 | #132 | Excellent 15.9% |
| Immigrants | Syria | 89.5 /100 | #133 | Excellent 15.9% |
| Immigrants | South America | 88.5 /100 | #134 | Excellent 15.9% |
| Immigrants | Sri Lanka | 88.2 /100 | #135 | Excellent 15.9% |
| Cypriots | 87.5 /100 | #136 | Excellent 15.9% |
| Immigrants | Azores | 87.2 /100 | #137 | Excellent 15.9% |
| Central Americans | 87.1 /100 | #138 | Excellent 16.0% |
| South Americans | 85.9 /100 | #139 | Excellent 16.0% |
| Immigrants | Netherlands | 85.3 /100 | #140 | Excellent 16.0% |
| Liberians | 83.3 /100 | #141 | Excellent 16.0% |
| Immigrants | Mexico | 83.3 /100 | #142 | Excellent 16.0% |
| Immigrants | Central America | 83.1 /100 | #143 | Excellent 16.0% |
| Immigrants | Kuwait | 81.4 /100 | #144 | Excellent 16.0% |
| Immigrants | Western Asia | 80.7 /100 | #145 | Excellent 16.0% |
| Immigrants | Hungary | 78.3 /100 | #146 | Good 16.1% |
| Colombians | 77.1 /100 | #147 | Good 16.1% |
| Nigerians | 76.8 /100 | #148 | Good 16.1% |