Cypriot vs Estonian Seniors Poverty Over the Age of 65
COMPARE
Cypriot
Estonian
Seniors Poverty Over the Age of 65
Seniors Poverty Over the Age of 65 Comparison
Cypriots
Estonians
10.2%
SENIORS POVERTY OVER THE AGE OF 65
95.5/ 100
METRIC RATING
99th/ 347
METRIC RANK
9.6%
SENIORS POVERTY OVER THE AGE OF 65
99.5/ 100
METRIC RATING
45th/ 347
METRIC RANK
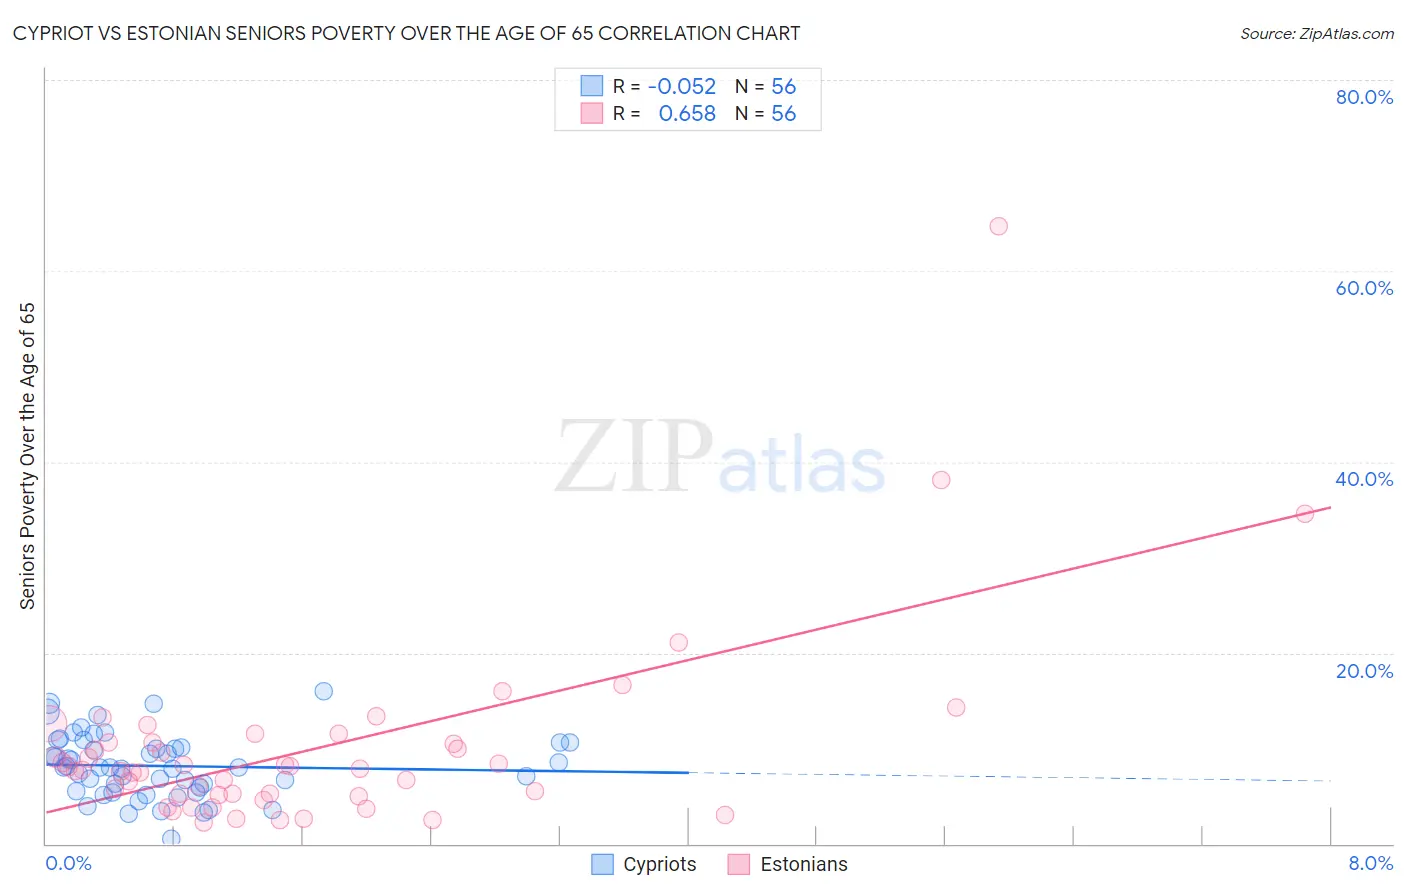
Cypriot vs Estonian Seniors Poverty Over the Age of 65 Correlation Chart
The statistical analysis conducted on geographies consisting of 61,790,190 people shows a slight negative correlation between the proportion of Cypriots and poverty level among seniors over the age of 65 in the United States with a correlation coefficient (R) of -0.052 and weighted average of 10.2%. Similarly, the statistical analysis conducted on geographies consisting of 123,369,266 people shows a significant positive correlation between the proportion of Estonians and poverty level among seniors over the age of 65 in the United States with a correlation coefficient (R) of 0.658 and weighted average of 9.6%, a difference of 5.7%.
Seniors Poverty Over the Age of 65 Correlation Summary
| Measurement | Cypriot | Estonian |
| Minimum | 0.57% | 2.2% |
| Maximum | 16.0% | 64.7% |
| Range | 15.4% | 62.5% |
| Mean | 8.1% | 9.9% |
| Median | 8.0% | 7.8% |
| Interquartile 25% (IQ1) | 5.7% | 5.2% |
| Interquartile 75% (IQ3) | 10.3% | 10.6% |
| Interquartile Range (IQR) | 4.6% | 5.4% |
| Standard Deviation (Sample) | 3.3% | 10.0% |
| Standard Deviation (Population) | 3.2% | 9.9% |
Similar Demographics by Seniors Poverty Over the Age of 65
Demographics Similar to Cypriots by Seniors Poverty Over the Age of 65
In terms of seniors poverty over the age of 65, the demographic groups most similar to Cypriots are Immigrants from Kuwait (10.2%, a difference of 0.0%), Marshallese (10.2%, a difference of 0.070%), Immigrants from Pakistan (10.2%, a difference of 0.16%), Basque (10.2%, a difference of 0.25%), and Immigrants from Jordan (10.2%, a difference of 0.39%).
| Demographics | Rating | Rank | Seniors Poverty Over the Age of 65 |
| Immigrants | Singapore | 96.9 /100 | #92 | Exceptional 10.1% |
| Immigrants | Sweden | 96.7 /100 | #93 | Exceptional 10.1% |
| Immigrants | Germany | 96.7 /100 | #94 | Exceptional 10.1% |
| Immigrants | Japan | 96.3 /100 | #95 | Exceptional 10.1% |
| Basques | 95.9 /100 | #96 | Exceptional 10.2% |
| Immigrants | Pakistan | 95.7 /100 | #97 | Exceptional 10.2% |
| Immigrants | Kuwait | 95.5 /100 | #98 | Exceptional 10.2% |
| Cypriots | 95.5 /100 | #99 | Exceptional 10.2% |
| Marshallese | 95.3 /100 | #100 | Exceptional 10.2% |
| Immigrants | Jordan | 94.7 /100 | #101 | Exceptional 10.2% |
| Delaware | 94.5 /100 | #102 | Exceptional 10.2% |
| Icelanders | 94.4 /100 | #103 | Exceptional 10.3% |
| South Africans | 94.3 /100 | #104 | Exceptional 10.3% |
| Aleuts | 94.1 /100 | #105 | Exceptional 10.3% |
| Kenyans | 94.1 /100 | #106 | Exceptional 10.3% |
Demographics Similar to Estonians by Seniors Poverty Over the Age of 65
In terms of seniors poverty over the age of 65, the demographic groups most similar to Estonians are Immigrants from Taiwan (9.7%, a difference of 0.14%), Immigrants from South Central Asia (9.7%, a difference of 0.15%), Austrian (9.6%, a difference of 0.18%), French (9.7%, a difference of 0.25%), and Eastern European (9.6%, a difference of 0.28%).
| Demographics | Rating | Rank | Seniors Poverty Over the Age of 65 |
| Belgians | 99.7 /100 | #38 | Exceptional 9.5% |
| Greeks | 99.6 /100 | #39 | Exceptional 9.6% |
| Assyrians/Chaldeans/Syriacs | 99.6 /100 | #40 | Exceptional 9.6% |
| Immigrants | North Macedonia | 99.6 /100 | #41 | Exceptional 9.6% |
| Zimbabweans | 99.6 /100 | #42 | Exceptional 9.6% |
| Eastern Europeans | 99.6 /100 | #43 | Exceptional 9.6% |
| Austrians | 99.5 /100 | #44 | Exceptional 9.6% |
| Estonians | 99.5 /100 | #45 | Exceptional 9.6% |
| Immigrants | Taiwan | 99.5 /100 | #46 | Exceptional 9.7% |
| Immigrants | South Central Asia | 99.5 /100 | #47 | Exceptional 9.7% |
| French | 99.5 /100 | #48 | Exceptional 9.7% |
| Immigrants | Lithuania | 99.4 /100 | #49 | Exceptional 9.7% |
| Hungarians | 99.4 /100 | #50 | Exceptional 9.7% |
| Carpatho Rusyns | 99.3 /100 | #51 | Exceptional 9.7% |
| Filipinos | 99.3 /100 | #52 | Exceptional 9.7% |