Cuban vs Native Hawaiian Female Poverty Among 25-34 Year Olds
COMPARE
Cuban
Native Hawaiian
Female Poverty Among 25-34 Year Olds
Female Poverty Among 25-34 Year Olds Comparison
Cubans
Native Hawaiians
14.7%
FEMALE POVERTY AMONG 25-34 YEAR OLDS
1.6/ 100
METRIC RATING
234th/ 347
METRIC RANK
13.2%
FEMALE POVERTY AMONG 25-34 YEAR OLDS
78.9/ 100
METRIC RATING
144th/ 347
METRIC RANK
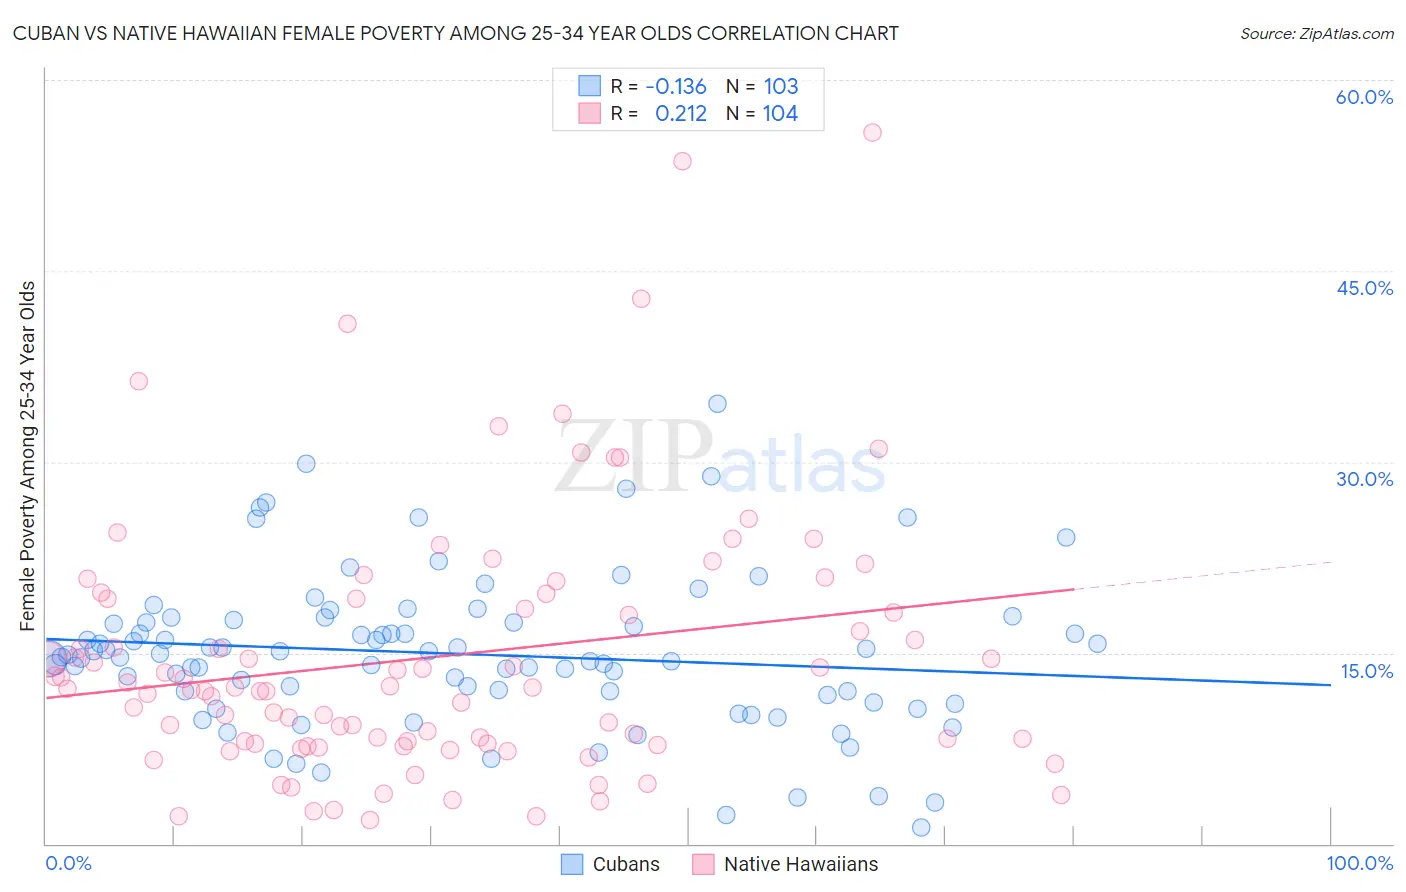
Cuban vs Native Hawaiian Female Poverty Among 25-34 Year Olds Correlation Chart
The statistical analysis conducted on geographies consisting of 440,903,752 people shows a poor negative correlation between the proportion of Cubans and poverty level among females between the ages 25 and 34 in the United States with a correlation coefficient (R) of -0.136 and weighted average of 14.7%. Similarly, the statistical analysis conducted on geographies consisting of 328,500,665 people shows a weak positive correlation between the proportion of Native Hawaiians and poverty level among females between the ages 25 and 34 in the United States with a correlation coefficient (R) of 0.212 and weighted average of 13.2%, a difference of 11.7%.
Female Poverty Among 25-34 Year Olds Correlation Summary
| Measurement | Cuban | Native Hawaiian |
| Minimum | 1.3% | 1.8% |
| Maximum | 34.5% | 55.9% |
| Range | 33.3% | 54.0% |
| Mean | 14.9% | 14.7% |
| Median | 14.7% | 12.2% |
| Interquartile 25% (IQ1) | 11.7% | 7.8% |
| Interquartile 75% (IQ3) | 17.4% | 19.2% |
| Interquartile Range (IQR) | 5.7% | 11.4% |
| Standard Deviation (Sample) | 6.0% | 10.3% |
| Standard Deviation (Population) | 6.0% | 10.2% |
Similar Demographics by Female Poverty Among 25-34 Year Olds
Demographics Similar to Cubans by Female Poverty Among 25-34 Year Olds
In terms of female poverty among 25-34 year olds, the demographic groups most similar to Cubans are Immigrants from Jamaica (14.7%, a difference of 0.18%), Salvadoran (14.7%, a difference of 0.20%), Immigrants from Ghana (14.7%, a difference of 0.20%), White/Caucasian (14.7%, a difference of 0.23%), and Alsatian (14.7%, a difference of 0.24%).
| Demographics | Rating | Rank | Female Poverty Among 25-34 Year Olds |
| Celtics | 2.8 /100 | #227 | Tragic 14.5% |
| Vietnamese | 2.6 /100 | #228 | Tragic 14.6% |
| Spanish | 2.5 /100 | #229 | Tragic 14.6% |
| Spaniards | 2.3 /100 | #230 | Tragic 14.6% |
| Delaware | 2.3 /100 | #231 | Tragic 14.6% |
| Immigrants | Ecuador | 1.9 /100 | #232 | Tragic 14.6% |
| Whites/Caucasians | 1.8 /100 | #233 | Tragic 14.7% |
| Cubans | 1.6 /100 | #234 | Tragic 14.7% |
| Immigrants | Jamaica | 1.4 /100 | #235 | Tragic 14.7% |
| Salvadorans | 1.4 /100 | #236 | Tragic 14.7% |
| Immigrants | Ghana | 1.4 /100 | #237 | Tragic 14.7% |
| Alsatians | 1.4 /100 | #238 | Tragic 14.7% |
| Malaysians | 1.4 /100 | #239 | Tragic 14.7% |
| Immigrants | Grenada | 1.3 /100 | #240 | Tragic 14.7% |
| Scotch-Irish | 1.2 /100 | #241 | Tragic 14.8% |
Demographics Similar to Native Hawaiians by Female Poverty Among 25-34 Year Olds
In terms of female poverty among 25-34 year olds, the demographic groups most similar to Native Hawaiians are Colombian (13.2%, a difference of 0.21%), South American (13.2%, a difference of 0.25%), European (13.2%, a difference of 0.26%), Lebanese (13.2%, a difference of 0.26%), and Sierra Leonean (13.2%, a difference of 0.32%).
| Demographics | Rating | Rank | Female Poverty Among 25-34 Year Olds |
| Immigrants | Chile | 84.6 /100 | #137 | Excellent 13.1% |
| Brazilians | 84.5 /100 | #138 | Excellent 13.1% |
| Austrians | 83.7 /100 | #139 | Excellent 13.1% |
| Immigrants | Iraq | 83.6 /100 | #140 | Excellent 13.1% |
| New Zealanders | 83.4 /100 | #141 | Excellent 13.1% |
| Scandinavians | 82.3 /100 | #142 | Excellent 13.1% |
| Israelis | 81.9 /100 | #143 | Excellent 13.1% |
| Native Hawaiians | 78.9 /100 | #144 | Good 13.2% |
| Colombians | 77.2 /100 | #145 | Good 13.2% |
| South Americans | 76.9 /100 | #146 | Good 13.2% |
| Europeans | 76.8 /100 | #147 | Good 13.2% |
| Lebanese | 76.8 /100 | #148 | Good 13.2% |
| Sierra Leoneans | 76.3 /100 | #149 | Good 13.2% |
| Iraqis | 76.0 /100 | #150 | Good 13.2% |
| Costa Ricans | 75.8 /100 | #151 | Good 13.2% |