Cuban vs Indian (Asian) Single Father Poverty
COMPARE
Cuban
Indian (Asian)
Single Father Poverty
Single Father Poverty Comparison
Cubans
Indians (Asian)
16.6%
SINGLE FATHER POVERTY
16.5/ 100
METRIC RATING
201st/ 347
METRIC RANK
14.8%
SINGLE FATHER POVERTY
100.0/ 100
METRIC RATING
41st/ 347
METRIC RANK
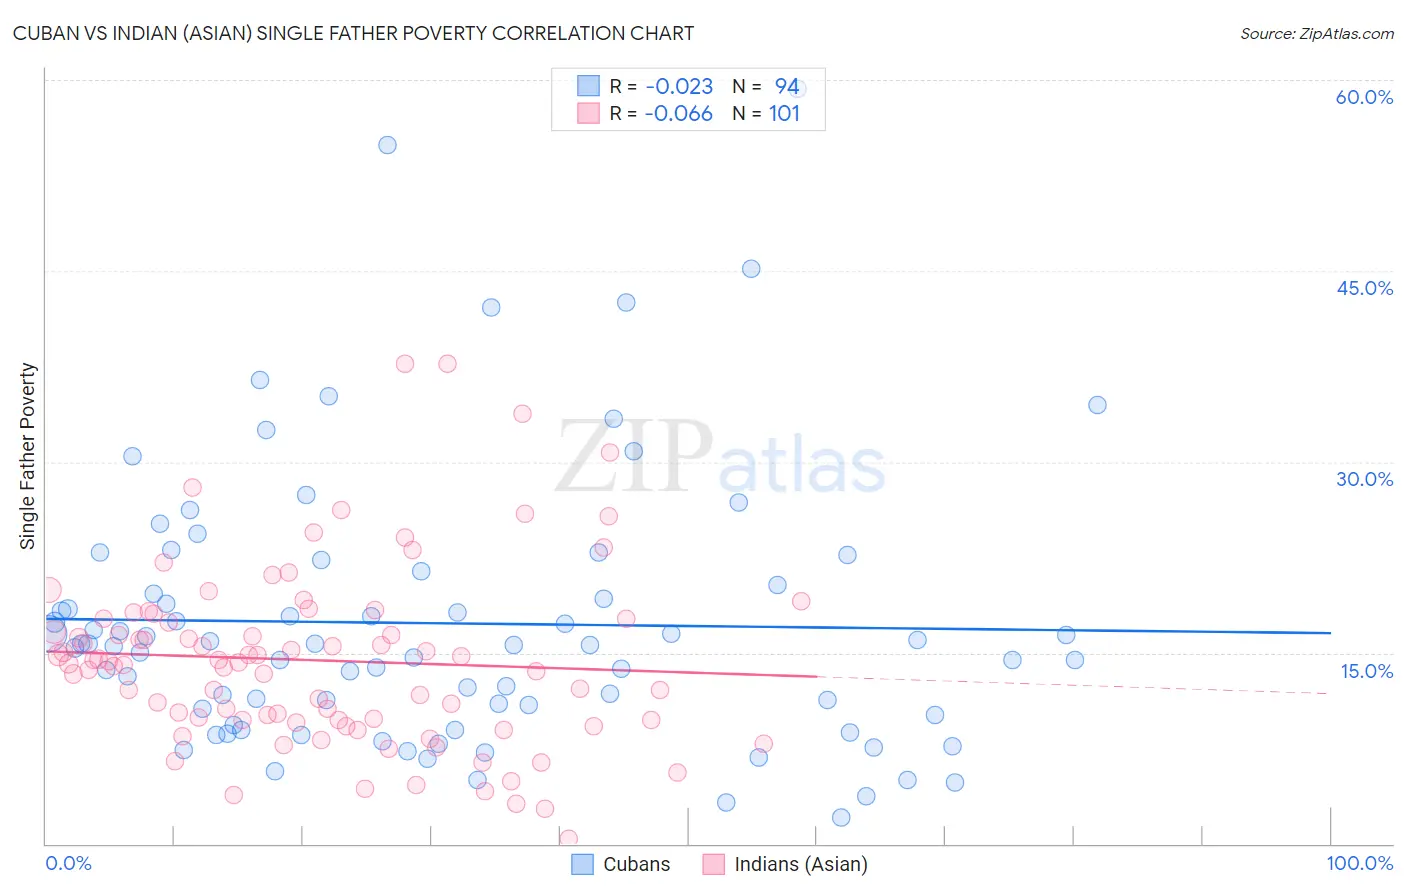
Cuban vs Indian (Asian) Single Father Poverty Correlation Chart
The statistical analysis conducted on geographies consisting of 350,103,033 people shows no correlation between the proportion of Cubans and poverty level among single fathers in the United States with a correlation coefficient (R) of -0.023 and weighted average of 16.6%. Similarly, the statistical analysis conducted on geographies consisting of 373,368,189 people shows a slight negative correlation between the proportion of Indians (Asian) and poverty level among single fathers in the United States with a correlation coefficient (R) of -0.066 and weighted average of 14.8%, a difference of 12.1%.
Single Father Poverty Correlation Summary
| Measurement | Cuban | Indian (Asian) |
| Minimum | 2.1% | 0.43% |
| Maximum | 59.3% | 37.7% |
| Range | 57.2% | 37.3% |
| Mean | 17.3% | 14.4% |
| Median | 15.6% | 14.2% |
| Interquartile 25% (IQ1) | 10.1% | 9.7% |
| Interquartile 75% (IQ3) | 20.3% | 17.7% |
| Interquartile Range (IQR) | 10.2% | 8.0% |
| Standard Deviation (Sample) | 10.7% | 7.1% |
| Standard Deviation (Population) | 10.7% | 7.0% |
Similar Demographics by Single Father Poverty
Demographics Similar to Cubans by Single Father Poverty
In terms of single father poverty, the demographic groups most similar to Cubans are Immigrants from Croatia (16.6%, a difference of 0.0%), Syrian (16.6%, a difference of 0.070%), Immigrants from North America (16.6%, a difference of 0.12%), Immigrants from Guatemala (16.6%, a difference of 0.15%), and Venezuelan (16.6%, a difference of 0.19%).
| Demographics | Rating | Rank | Single Father Poverty |
| Cape Verdeans | 24.4 /100 | #194 | Fair 16.5% |
| Immigrants | Barbados | 24.3 /100 | #195 | Fair 16.5% |
| Immigrants | Canada | 21.9 /100 | #196 | Fair 16.5% |
| Immigrants | Northern Europe | 20.3 /100 | #197 | Fair 16.5% |
| Romanians | 20.1 /100 | #198 | Fair 16.5% |
| Immigrants | Belize | 19.8 /100 | #199 | Poor 16.5% |
| Syrians | 17.4 /100 | #200 | Poor 16.6% |
| Cubans | 16.5 /100 | #201 | Poor 16.6% |
| Immigrants | Croatia | 16.5 /100 | #202 | Poor 16.6% |
| Immigrants | North America | 15.1 /100 | #203 | Poor 16.6% |
| Immigrants | Guatemala | 14.8 /100 | #204 | Poor 16.6% |
| Venezuelans | 14.3 /100 | #205 | Poor 16.6% |
| Immigrants | Senegal | 13.7 /100 | #206 | Poor 16.6% |
| New Zealanders | 13.7 /100 | #207 | Poor 16.6% |
| Eastern Europeans | 13.7 /100 | #208 | Poor 16.6% |
Demographics Similar to Indians (Asian) by Single Father Poverty
In terms of single father poverty, the demographic groups most similar to Indians (Asian) are Immigrants from Nepal (14.8%, a difference of 0.0%), Immigrants from Eritrea (14.8%, a difference of 0.040%), Pima (14.8%, a difference of 0.17%), Immigrants from Asia (14.7%, a difference of 0.37%), and Bolivian (14.7%, a difference of 0.54%).
| Demographics | Rating | Rank | Single Father Poverty |
| Egyptians | 100.0 /100 | #34 | Exceptional 14.7% |
| Immigrants | Bolivia | 100.0 /100 | #35 | Exceptional 14.7% |
| Immigrants | Indonesia | 100.0 /100 | #36 | Exceptional 14.7% |
| Immigrants | Eastern Africa | 100.0 /100 | #37 | Exceptional 14.7% |
| Bolivians | 100.0 /100 | #38 | Exceptional 14.7% |
| Immigrants | Asia | 100.0 /100 | #39 | Exceptional 14.7% |
| Pima | 100.0 /100 | #40 | Exceptional 14.8% |
| Indians (Asian) | 100.0 /100 | #41 | Exceptional 14.8% |
| Immigrants | Nepal | 100.0 /100 | #42 | Exceptional 14.8% |
| Immigrants | Eritrea | 100.0 /100 | #43 | Exceptional 14.8% |
| Salvadorans | 100.0 /100 | #44 | Exceptional 14.9% |
| Immigrants | Somalia | 100.0 /100 | #45 | Exceptional 14.9% |
| Immigrants | Cambodia | 99.9 /100 | #46 | Exceptional 14.9% |
| Immigrants | China | 99.9 /100 | #47 | Exceptional 14.9% |
| Malaysians | 99.9 /100 | #48 | Exceptional 14.9% |