Cree vs Immigrants from Hong Kong Female Poverty Among 25-34 Year Olds
COMPARE
Cree
Immigrants from Hong Kong
Female Poverty Among 25-34 Year Olds
Female Poverty Among 25-34 Year Olds Comparison
Cree
Immigrants from Hong Kong
15.6%
FEMALE POVERTY AMONG 25-34 YEAR OLDS
0.1/ 100
METRIC RATING
271st/ 347
METRIC RANK
10.4%
FEMALE POVERTY AMONG 25-34 YEAR OLDS
100.0/ 100
METRIC RATING
5th/ 347
METRIC RANK
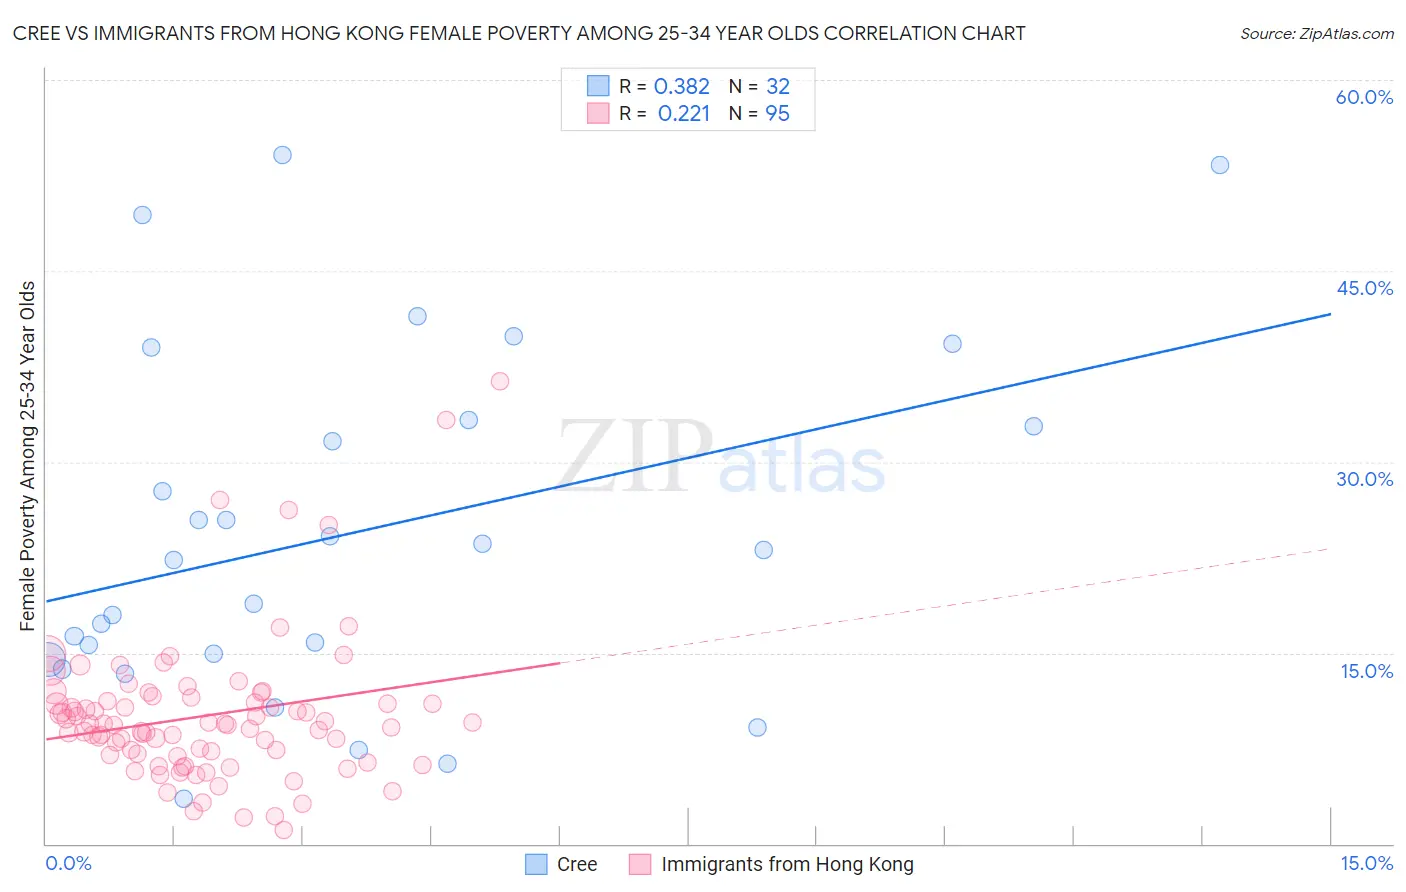
Cree vs Immigrants from Hong Kong Female Poverty Among 25-34 Year Olds Correlation Chart
The statistical analysis conducted on geographies consisting of 75,962,036 people shows a mild positive correlation between the proportion of Cree and poverty level among females between the ages 25 and 34 in the United States with a correlation coefficient (R) of 0.382 and weighted average of 15.6%. Similarly, the statistical analysis conducted on geographies consisting of 250,705,570 people shows a weak positive correlation between the proportion of Immigrants from Hong Kong and poverty level among females between the ages 25 and 34 in the United States with a correlation coefficient (R) of 0.221 and weighted average of 10.4%, a difference of 50.5%.
Female Poverty Among 25-34 Year Olds Correlation Summary
| Measurement | Cree | Immigrants from Hong Kong |
| Minimum | 3.5% | 1.0% |
| Maximum | 54.1% | 36.4% |
| Range | 50.6% | 35.3% |
| Mean | 24.4% | 10.1% |
| Median | 22.7% | 9.4% |
| Interquartile 25% (IQ1) | 14.7% | 7.0% |
| Interquartile 75% (IQ3) | 33.1% | 11.2% |
| Interquartile Range (IQR) | 18.4% | 4.2% |
| Standard Deviation (Sample) | 13.7% | 5.7% |
| Standard Deviation (Population) | 13.4% | 5.7% |
Similar Demographics by Female Poverty Among 25-34 Year Olds
Demographics Similar to Cree by Female Poverty Among 25-34 Year Olds
In terms of female poverty among 25-34 year olds, the demographic groups most similar to Cree are British West Indian (15.6%, a difference of 0.010%), Senegalese (15.6%, a difference of 0.060%), Subsaharan African (15.6%, a difference of 0.16%), Nonimmigrants (15.6%, a difference of 0.17%), and Immigrants from Senegal (15.6%, a difference of 0.37%).
| Demographics | Rating | Rank | Female Poverty Among 25-34 Year Olds |
| Pennsylvania Germans | 0.1 /100 | #264 | Tragic 15.4% |
| Immigrants | Liberia | 0.1 /100 | #265 | Tragic 15.4% |
| Immigrants | Somalia | 0.1 /100 | #266 | Tragic 15.4% |
| Central Americans | 0.1 /100 | #267 | Tragic 15.5% |
| Immigrants | Senegal | 0.1 /100 | #268 | Tragic 15.6% |
| Sub-Saharan Africans | 0.1 /100 | #269 | Tragic 15.6% |
| British West Indians | 0.1 /100 | #270 | Tragic 15.6% |
| Cree | 0.1 /100 | #271 | Tragic 15.6% |
| Senegalese | 0.1 /100 | #272 | Tragic 15.6% |
| Immigrants | Nonimmigrants | 0.1 /100 | #273 | Tragic 15.6% |
| Immigrants | Caribbean | 0.0 /100 | #274 | Tragic 15.7% |
| Immigrants | Azores | 0.0 /100 | #275 | Tragic 15.8% |
| Immigrants | Zaire | 0.0 /100 | #276 | Tragic 15.8% |
| Immigrants | Micronesia | 0.0 /100 | #277 | Tragic 15.8% |
| French American Indians | 0.0 /100 | #278 | Tragic 15.9% |
Demographics Similar to Immigrants from Hong Kong by Female Poverty Among 25-34 Year Olds
In terms of female poverty among 25-34 year olds, the demographic groups most similar to Immigrants from Hong Kong are Thai (10.2%, a difference of 1.4%), Filipino (10.2%, a difference of 1.5%), Immigrants from Taiwan (10.0%, a difference of 3.6%), Immigrants from South Central Asia (10.8%, a difference of 3.7%), and Chinese (11.0%, a difference of 5.7%).
| Demographics | Rating | Rank | Female Poverty Among 25-34 Year Olds |
| Immigrants | India | 100.0 /100 | #1 | Exceptional 9.7% |
| Immigrants | Taiwan | 100.0 /100 | #2 | Exceptional 10.0% |
| Filipinos | 100.0 /100 | #3 | Exceptional 10.2% |
| Thais | 100.0 /100 | #4 | Exceptional 10.2% |
| Immigrants | Hong Kong | 100.0 /100 | #5 | Exceptional 10.4% |
| Immigrants | South Central Asia | 100.0 /100 | #6 | Exceptional 10.8% |
| Chinese | 100.0 /100 | #7 | Exceptional 11.0% |
| Immigrants | Iran | 100.0 /100 | #8 | Exceptional 11.0% |
| Immigrants | Singapore | 100.0 /100 | #9 | Exceptional 11.1% |
| Immigrants | Lithuania | 100.0 /100 | #10 | Exceptional 11.1% |
| Immigrants | Korea | 100.0 /100 | #11 | Exceptional 11.1% |
| Immigrants | Ireland | 100.0 /100 | #12 | Exceptional 11.2% |
| Burmese | 100.0 /100 | #13 | Exceptional 11.2% |
| Indians (Asian) | 100.0 /100 | #14 | Exceptional 11.2% |
| Assyrians/Chaldeans/Syriacs | 100.0 /100 | #15 | Exceptional 11.2% |