Chippewa vs Immigrants from Denmark Child Poverty Under the Age of 16
COMPARE
Chippewa
Immigrants from Denmark
Child Poverty Under the Age of 16
Child Poverty Under the Age of 16 Comparison
Chippewa
Immigrants from Denmark
20.5%
CHILD POVERTY UNDER THE AGE OF 16
0.0/ 100
METRIC RATING
291st/ 347
METRIC RANK
14.9%
CHILD POVERTY UNDER THE AGE OF 16
93.5/ 100
METRIC RATING
111th/ 347
METRIC RANK
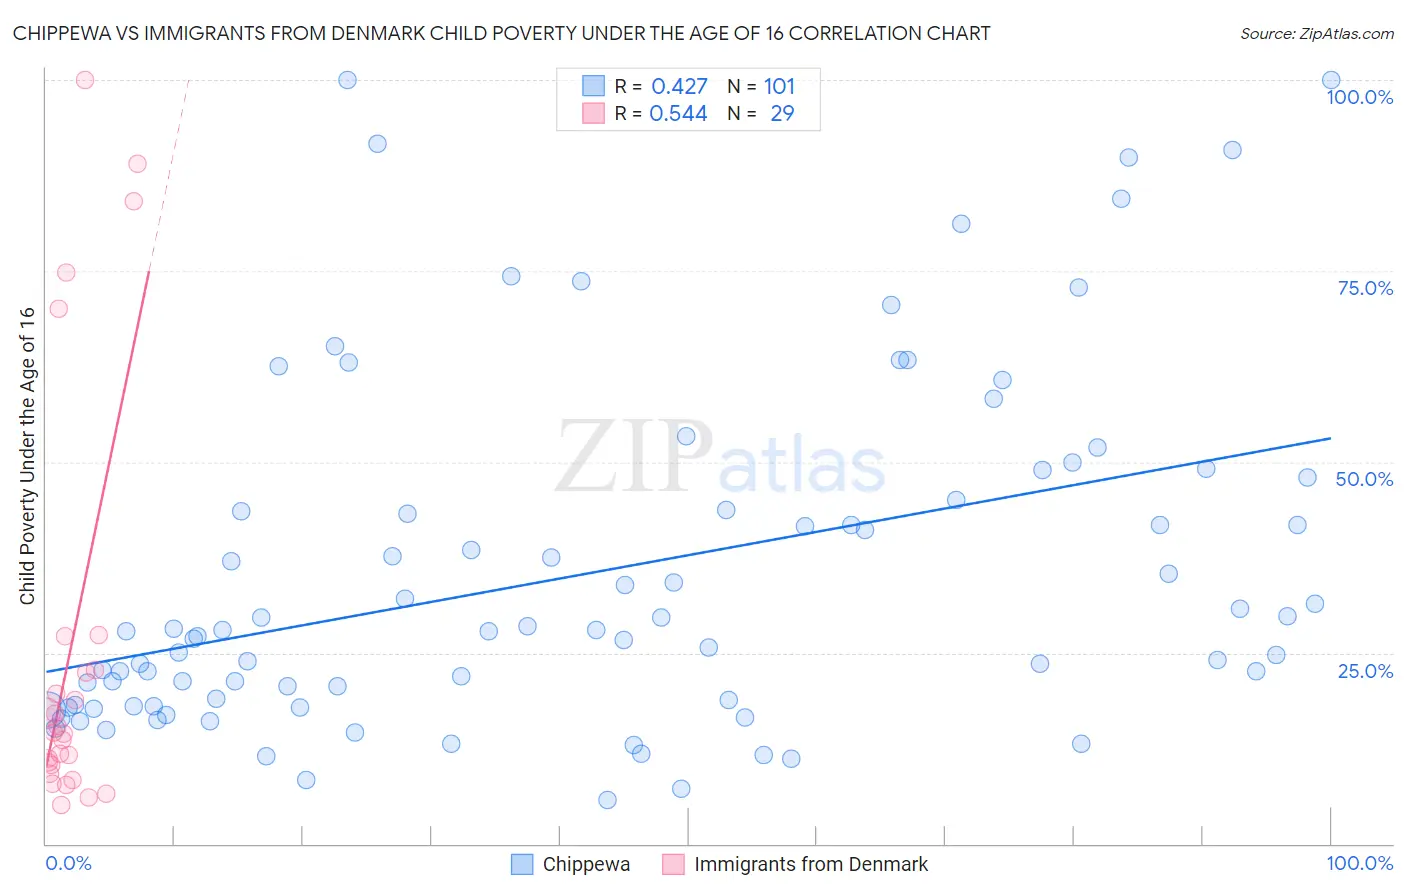
Chippewa vs Immigrants from Denmark Child Poverty Under the Age of 16 Correlation Chart
The statistical analysis conducted on geographies consisting of 214,061,702 people shows a moderate positive correlation between the proportion of Chippewa and poverty level among children under the age of 16 in the United States with a correlation coefficient (R) of 0.427 and weighted average of 20.5%. Similarly, the statistical analysis conducted on geographies consisting of 135,715,778 people shows a substantial positive correlation between the proportion of Immigrants from Denmark and poverty level among children under the age of 16 in the United States with a correlation coefficient (R) of 0.544 and weighted average of 14.9%, a difference of 37.6%.
Child Poverty Under the Age of 16 Correlation Summary
| Measurement | Chippewa | Immigrants from Denmark |
| Minimum | 5.7% | 5.1% |
| Maximum | 100.0% | 100.0% |
| Range | 94.3% | 94.9% |
| Mean | 35.2% | 26.0% |
| Median | 27.9% | 14.6% |
| Interquartile 25% (IQ1) | 18.1% | 9.7% |
| Interquartile 75% (IQ3) | 44.4% | 25.0% |
| Interquartile Range (IQR) | 26.3% | 15.3% |
| Standard Deviation (Sample) | 22.5% | 27.7% |
| Standard Deviation (Population) | 22.4% | 27.3% |
Similar Demographics by Child Poverty Under the Age of 16
Demographics Similar to Chippewa by Child Poverty Under the Age of 16
In terms of child poverty under the age of 16, the demographic groups most similar to Chippewa are Immigrants from Latin America (20.5%, a difference of 0.040%), Immigrants from Senegal (20.6%, a difference of 0.47%), Haitian (20.7%, a difference of 0.68%), Yaqui (20.4%, a difference of 0.75%), and Senegalese (20.4%, a difference of 0.78%).
| Demographics | Rating | Rank | Child Poverty Under the Age of 16 |
| West Indians | 0.0 /100 | #284 | Tragic 20.1% |
| Immigrants | St. Vincent and the Grenadines | 0.0 /100 | #285 | Tragic 20.1% |
| Immigrants | West Indies | 0.0 /100 | #286 | Tragic 20.2% |
| Blackfeet | 0.0 /100 | #287 | Tragic 20.2% |
| Immigrants | Belize | 0.0 /100 | #288 | Tragic 20.3% |
| Senegalese | 0.0 /100 | #289 | Tragic 20.4% |
| Yaqui | 0.0 /100 | #290 | Tragic 20.4% |
| Chippewa | 0.0 /100 | #291 | Tragic 20.5% |
| Immigrants | Latin America | 0.0 /100 | #292 | Tragic 20.5% |
| Immigrants | Senegal | 0.0 /100 | #293 | Tragic 20.6% |
| Haitians | 0.0 /100 | #294 | Tragic 20.7% |
| Mexicans | 0.0 /100 | #295 | Tragic 20.7% |
| Immigrants | Caribbean | 0.0 /100 | #296 | Tragic 20.8% |
| Hispanics or Latinos | 0.0 /100 | #297 | Tragic 20.8% |
| Arapaho | 0.0 /100 | #298 | Tragic 20.8% |
Demographics Similar to Immigrants from Denmark by Child Poverty Under the Age of 16
In terms of child poverty under the age of 16, the demographic groups most similar to Immigrants from Denmark are English (14.9%, a difference of 0.010%), Irish (14.9%, a difference of 0.060%), Belgian (14.9%, a difference of 0.10%), Sri Lankan (14.9%, a difference of 0.13%), and Immigrants from Ukraine (14.9%, a difference of 0.18%).
| Demographics | Rating | Rank | Child Poverty Under the Age of 16 |
| Immigrants | England | 94.8 /100 | #104 | Exceptional 14.8% |
| Basques | 94.7 /100 | #105 | Exceptional 14.8% |
| Serbians | 94.5 /100 | #106 | Exceptional 14.8% |
| Chileans | 94.4 /100 | #107 | Exceptional 14.8% |
| Jordanians | 94.2 /100 | #108 | Exceptional 14.8% |
| Tlingit-Haida | 94.1 /100 | #109 | Exceptional 14.9% |
| English | 93.5 /100 | #110 | Exceptional 14.9% |
| Immigrants | Denmark | 93.5 /100 | #111 | Exceptional 14.9% |
| Irish | 93.4 /100 | #112 | Exceptional 14.9% |
| Belgians | 93.3 /100 | #113 | Exceptional 14.9% |
| Sri Lankans | 93.2 /100 | #114 | Exceptional 14.9% |
| Immigrants | Ukraine | 93.1 /100 | #115 | Exceptional 14.9% |
| Carpatho Rusyns | 93.1 /100 | #116 | Exceptional 14.9% |
| Immigrants | Norway | 92.8 /100 | #117 | Exceptional 15.0% |
| Immigrants | Malaysia | 92.6 /100 | #118 | Exceptional 15.0% |