Chippewa vs Costa Rican Family Poverty
COMPARE
Chippewa
Costa Rican
Family Poverty
Family Poverty Comparison
Chippewa
Costa Ricans
11.2%
FAMILY POVERTY
0.1/ 100
METRIC RATING
277th/ 347
METRIC RANK
9.0%
FAMILY POVERTY
49.3/ 100
METRIC RATING
175th/ 347
METRIC RANK
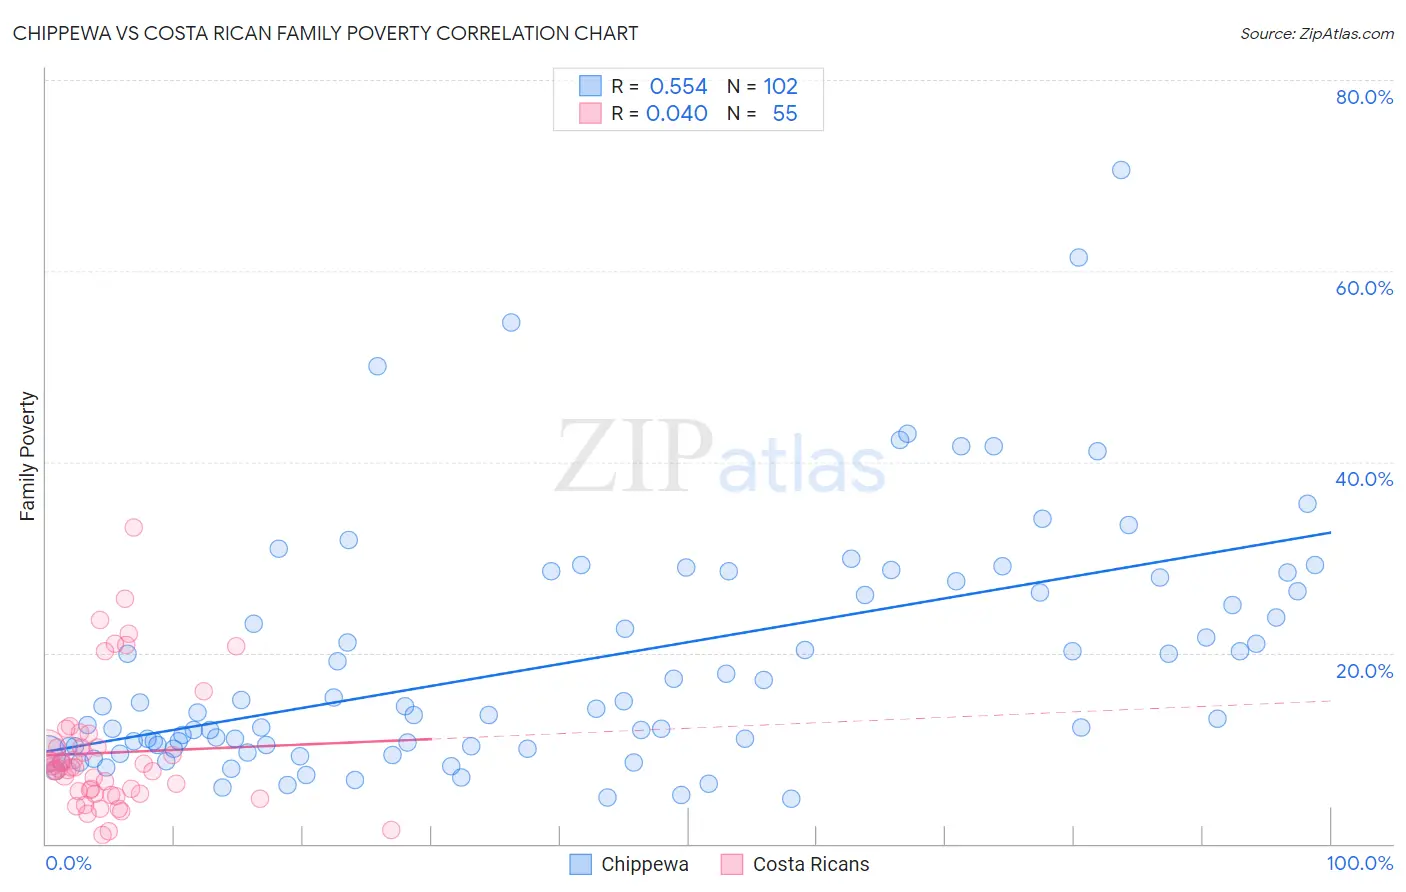
Chippewa vs Costa Rican Family Poverty Correlation Chart
The statistical analysis conducted on geographies consisting of 214,735,331 people shows a substantial positive correlation between the proportion of Chippewa and poverty level among families in the United States with a correlation coefficient (R) of 0.554 and weighted average of 11.2%. Similarly, the statistical analysis conducted on geographies consisting of 253,260,366 people shows no correlation between the proportion of Costa Ricans and poverty level among families in the United States with a correlation coefficient (R) of 0.040 and weighted average of 9.0%, a difference of 24.7%.
Family Poverty Correlation Summary
| Measurement | Chippewa | Costa Rican |
| Minimum | 4.7% | 0.94% |
| Maximum | 70.6% | 33.1% |
| Range | 65.9% | 32.2% |
| Mean | 19.0% | 9.5% |
| Median | 14.0% | 8.0% |
| Interquartile 25% (IQ1) | 10.2% | 5.2% |
| Interquartile 75% (IQ3) | 26.5% | 10.1% |
| Interquartile Range (IQR) | 16.3% | 4.9% |
| Standard Deviation (Sample) | 12.8% | 6.6% |
| Standard Deviation (Population) | 12.7% | 6.6% |
Similar Demographics by Family Poverty
Demographics Similar to Chippewa by Family Poverty
In terms of family poverty, the demographic groups most similar to Chippewa are Guyanese (11.2%, a difference of 0.030%), Immigrants from Guyana (11.2%, a difference of 0.090%), Central American (11.2%, a difference of 0.11%), Spanish American (11.2%, a difference of 0.16%), and Blackfeet (11.3%, a difference of 0.16%).
| Demographics | Rating | Rank | Family Poverty |
| Immigrants | Nicaragua | 0.1 /100 | #270 | Tragic 11.1% |
| Immigrants | Bahamas | 0.1 /100 | #271 | Tragic 11.1% |
| Immigrants | Jamaica | 0.1 /100 | #272 | Tragic 11.2% |
| Somalis | 0.1 /100 | #273 | Tragic 11.2% |
| Spanish Americans | 0.1 /100 | #274 | Tragic 11.2% |
| Central Americans | 0.1 /100 | #275 | Tragic 11.2% |
| Immigrants | Guyana | 0.1 /100 | #276 | Tragic 11.2% |
| Chippewa | 0.1 /100 | #277 | Tragic 11.2% |
| Guyanese | 0.1 /100 | #278 | Tragic 11.2% |
| Blackfeet | 0.0 /100 | #279 | Tragic 11.3% |
| Belizeans | 0.0 /100 | #280 | Tragic 11.3% |
| Immigrants | West Indies | 0.0 /100 | #281 | Tragic 11.3% |
| Immigrants | Cuba | 0.0 /100 | #282 | Tragic 11.3% |
| Indonesians | 0.0 /100 | #283 | Tragic 11.3% |
| Yaqui | 0.0 /100 | #284 | Tragic 11.3% |
Demographics Similar to Costa Ricans by Family Poverty
In terms of family poverty, the demographic groups most similar to Costa Ricans are Immigrants from Albania (9.0%, a difference of 0.090%), Immigrants from Syria (9.0%, a difference of 0.24%), Hawaiian (9.0%, a difference of 0.27%), Immigrants from Cameroon (9.0%, a difference of 0.28%), and Immigrants from Iraq (9.1%, a difference of 0.65%).
| Demographics | Rating | Rank | Family Poverty |
| Israelis | 62.1 /100 | #168 | Good 8.9% |
| Immigrants | Chile | 59.6 /100 | #169 | Average 8.9% |
| Kenyans | 58.2 /100 | #170 | Average 8.9% |
| Lebanese | 57.6 /100 | #171 | Average 8.9% |
| Immigrants | Peru | 57.5 /100 | #172 | Average 8.9% |
| Immigrants | Fiji | 56.4 /100 | #173 | Average 8.9% |
| Immigrants | Albania | 50.0 /100 | #174 | Average 9.0% |
| Costa Ricans | 49.3 /100 | #175 | Average 9.0% |
| Immigrants | Syria | 47.5 /100 | #176 | Average 9.0% |
| Hawaiians | 47.2 /100 | #177 | Average 9.0% |
| Immigrants | Cameroon | 47.1 /100 | #178 | Average 9.0% |
| Immigrants | Iraq | 44.4 /100 | #179 | Average 9.1% |
| Immigrants | Uganda | 43.4 /100 | #180 | Average 9.1% |
| Hmong | 40.2 /100 | #181 | Average 9.1% |
| Immigrants | Morocco | 40.2 /100 | #182 | Average 9.1% |