Central American vs Immigrants from France Child Poverty Under the Age of 16
COMPARE
Central American
Immigrants from France
Child Poverty Under the Age of 16
Child Poverty Under the Age of 16 Comparison
Central Americans
Immigrants from France
20.0%
CHILD POVERTY UNDER THE AGE OF 16
0.0/ 100
METRIC RATING
281st/ 347
METRIC RANK
14.7%
CHILD POVERTY UNDER THE AGE OF 16
95.8/ 100
METRIC RATING
96th/ 347
METRIC RANK
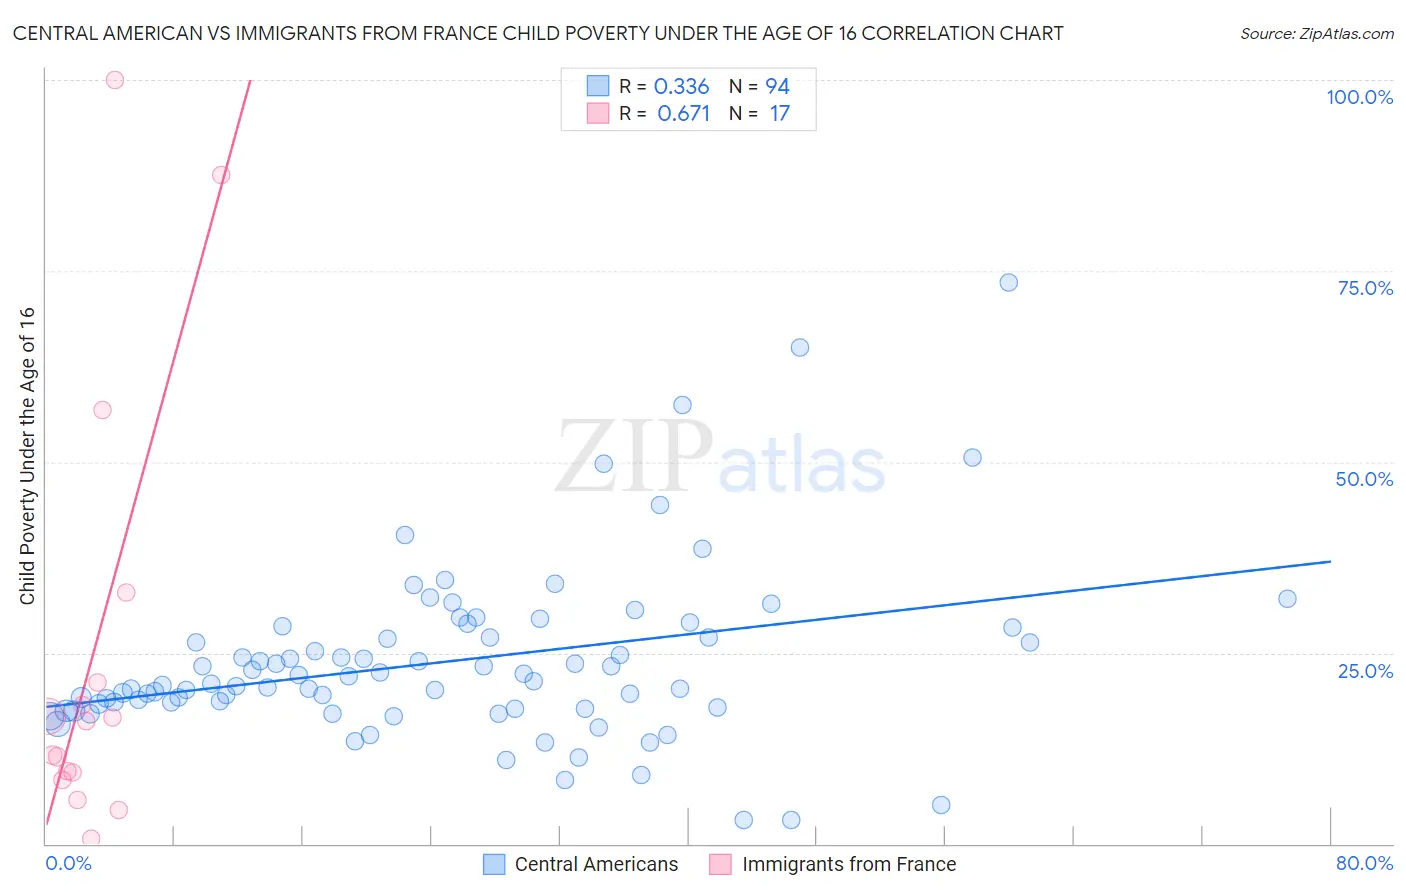
Central American vs Immigrants from France Child Poverty Under the Age of 16 Correlation Chart
The statistical analysis conducted on geographies consisting of 498,716,679 people shows a mild positive correlation between the proportion of Central Americans and poverty level among children under the age of 16 in the United States with a correlation coefficient (R) of 0.336 and weighted average of 20.0%. Similarly, the statistical analysis conducted on geographies consisting of 285,695,647 people shows a significant positive correlation between the proportion of Immigrants from France and poverty level among children under the age of 16 in the United States with a correlation coefficient (R) of 0.671 and weighted average of 14.7%, a difference of 36.5%.
Child Poverty Under the Age of 16 Correlation Summary
| Measurement | Central American | Immigrants from France |
| Minimum | 3.1% | 0.60% |
| Maximum | 73.5% | 100.0% |
| Range | 70.4% | 99.4% |
| Mean | 23.8% | 25.1% |
| Median | 21.1% | 16.0% |
| Interquartile 25% (IQ1) | 17.9% | 8.9% |
| Interquartile 75% (IQ3) | 27.0% | 27.0% |
| Interquartile Range (IQR) | 9.1% | 18.1% |
| Standard Deviation (Sample) | 11.4% | 28.9% |
| Standard Deviation (Population) | 11.3% | 28.1% |
Similar Demographics by Child Poverty Under the Age of 16
Demographics Similar to Central Americans by Child Poverty Under the Age of 16
In terms of child poverty under the age of 16, the demographic groups most similar to Central Americans are Barbadian (20.0%, a difference of 0.030%), Immigrants from Zaire (20.1%, a difference of 0.26%), West Indian (20.1%, a difference of 0.40%), Immigrants from St. Vincent and the Grenadines (20.1%, a difference of 0.47%), and Immigrants from West Indies (20.2%, a difference of 0.61%).
| Demographics | Rating | Rank | Child Poverty Under the Age of 16 |
| Immigrants | Cabo Verde | 0.1 /100 | #274 | Tragic 19.9% |
| Immigrants | Barbados | 0.1 /100 | #275 | Tragic 19.9% |
| Belizeans | 0.1 /100 | #276 | Tragic 19.9% |
| Iroquois | 0.1 /100 | #277 | Tragic 19.9% |
| Bangladeshis | 0.0 /100 | #278 | Tragic 19.9% |
| Sub-Saharan Africans | 0.0 /100 | #279 | Tragic 19.9% |
| Comanche | 0.0 /100 | #280 | Tragic 19.9% |
| Central Americans | 0.0 /100 | #281 | Tragic 20.0% |
| Barbadians | 0.0 /100 | #282 | Tragic 20.0% |
| Immigrants | Zaire | 0.0 /100 | #283 | Tragic 20.1% |
| West Indians | 0.0 /100 | #284 | Tragic 20.1% |
| Immigrants | St. Vincent and the Grenadines | 0.0 /100 | #285 | Tragic 20.1% |
| Immigrants | West Indies | 0.0 /100 | #286 | Tragic 20.2% |
| Blackfeet | 0.0 /100 | #287 | Tragic 20.2% |
| Immigrants | Belize | 0.0 /100 | #288 | Tragic 20.3% |
Demographics Similar to Immigrants from France by Child Poverty Under the Age of 16
In terms of child poverty under the age of 16, the demographic groups most similar to Immigrants from France are Paraguayan (14.7%, a difference of 0.12%), Immigrants from Belarus (14.7%, a difference of 0.13%), Immigrants from Croatia (14.6%, a difference of 0.25%), British (14.7%, a difference of 0.25%), and Immigrants from South Africa (14.6%, a difference of 0.41%).
| Demographics | Rating | Rank | Child Poverty Under the Age of 16 |
| Germans | 96.9 /100 | #89 | Exceptional 14.5% |
| Austrians | 96.9 /100 | #90 | Exceptional 14.5% |
| Immigrants | North America | 96.7 /100 | #91 | Exceptional 14.6% |
| Immigrants | Italy | 96.7 /100 | #92 | Exceptional 14.6% |
| Argentineans | 96.6 /100 | #93 | Exceptional 14.6% |
| Immigrants | South Africa | 96.3 /100 | #94 | Exceptional 14.6% |
| Immigrants | Croatia | 96.1 /100 | #95 | Exceptional 14.6% |
| Immigrants | France | 95.8 /100 | #96 | Exceptional 14.7% |
| Paraguayans | 95.7 /100 | #97 | Exceptional 14.7% |
| Immigrants | Belarus | 95.7 /100 | #98 | Exceptional 14.7% |
| British | 95.5 /100 | #99 | Exceptional 14.7% |
| Dutch | 95.1 /100 | #100 | Exceptional 14.8% |
| Immigrants | Switzerland | 95.1 /100 | #101 | Exceptional 14.8% |
| Romanians | 95.0 /100 | #102 | Exceptional 14.8% |
| Immigrants | Egypt | 94.9 /100 | #103 | Exceptional 14.8% |