Central American Indian vs Sierra Leonean Child Poverty Among Boys Under 16
COMPARE
Central American Indian
Sierra Leonean
Child Poverty Among Boys Under 16
Child Poverty Among Boys Under 16 Comparison
Central American Indians
Sierra Leoneans
22.5%
CHILD POVERTY AMONG BOYS UNDER 16
0.0/ 100
METRIC RATING
325th/ 347
METRIC RANK
17.8%
CHILD POVERTY AMONG BOYS UNDER 16
5.3/ 100
METRIC RATING
219th/ 347
METRIC RANK
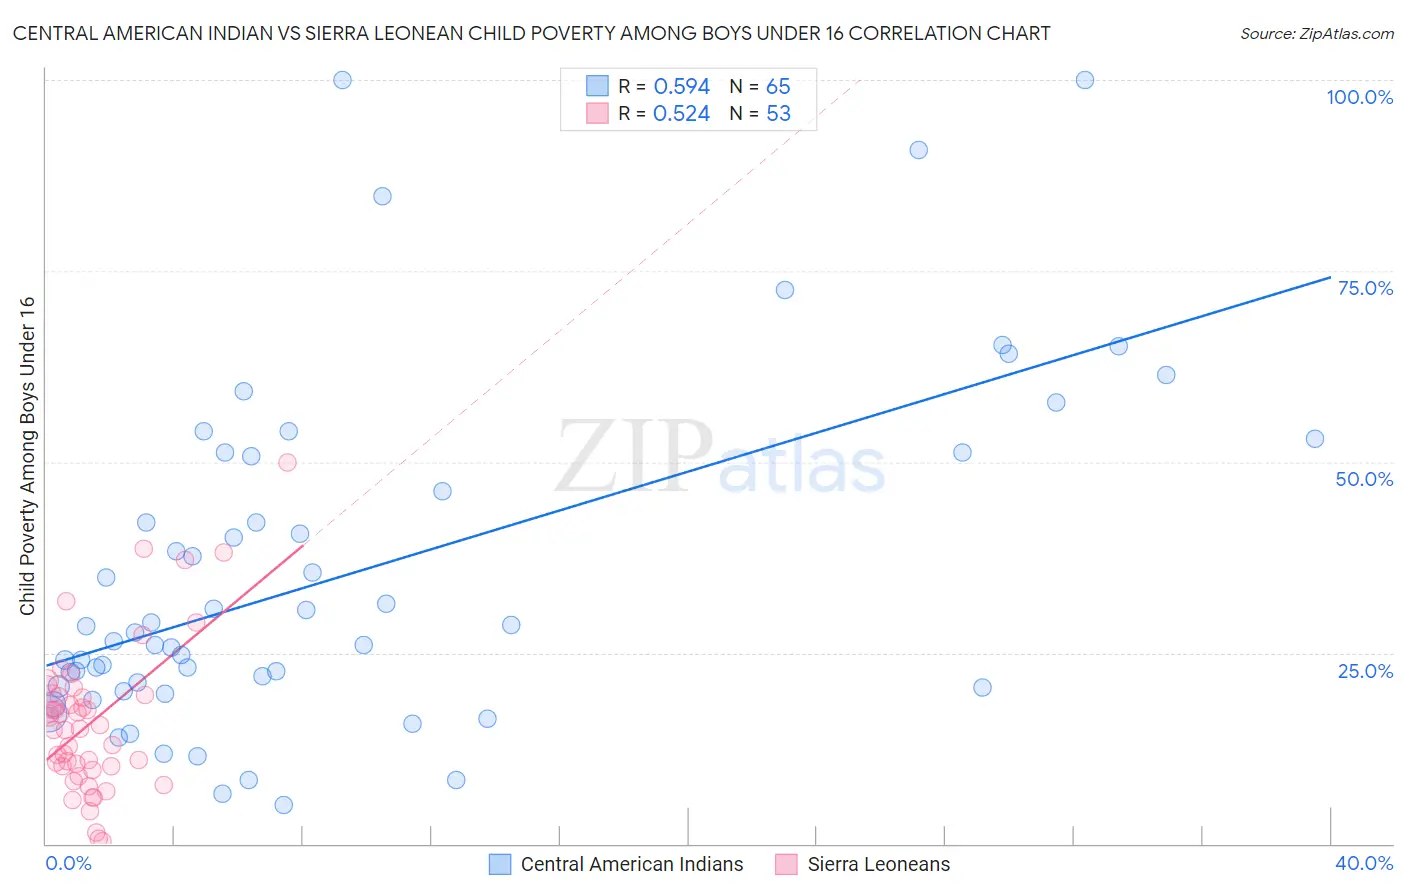
Central American Indian vs Sierra Leonean Child Poverty Among Boys Under 16 Correlation Chart
The statistical analysis conducted on geographies consisting of 323,455,194 people shows a substantial positive correlation between the proportion of Central American Indians and poverty level among boys under the age of 16 in the United States with a correlation coefficient (R) of 0.594 and weighted average of 22.5%. Similarly, the statistical analysis conducted on geographies consisting of 83,138,697 people shows a substantial positive correlation between the proportion of Sierra Leoneans and poverty level among boys under the age of 16 in the United States with a correlation coefficient (R) of 0.524 and weighted average of 17.8%, a difference of 26.8%.
Child Poverty Among Boys Under 16 Correlation Summary
| Measurement | Central American Indian | Sierra Leonean |
| Minimum | 5.0% | 0.35% |
| Maximum | 100.0% | 49.8% |
| Range | 95.0% | 49.5% |
| Mean | 35.4% | 16.1% |
| Median | 27.6% | 15.0% |
| Interquartile 25% (IQ1) | 20.6% | 9.9% |
| Interquartile 75% (IQ3) | 51.0% | 19.6% |
| Interquartile Range (IQR) | 30.4% | 9.7% |
| Standard Deviation (Sample) | 22.3% | 9.9% |
| Standard Deviation (Population) | 22.1% | 9.8% |
Similar Demographics by Child Poverty Among Boys Under 16
Demographics Similar to Central American Indians by Child Poverty Among Boys Under 16
In terms of child poverty among boys under 16, the demographic groups most similar to Central American Indians are Immigrants from Congo (22.4%, a difference of 0.50%), Honduran (22.3%, a difference of 0.87%), Paiute (22.8%, a difference of 1.1%), Immigrants from Honduras (22.8%, a difference of 1.3%), and Immigrants from Dominica (22.2%, a difference of 1.4%).
| Demographics | Rating | Rank | Child Poverty Among Boys Under 16 |
| Yakama | 0.0 /100 | #318 | Tragic 21.7% |
| Dutch West Indians | 0.0 /100 | #319 | Tragic 21.8% |
| U.S. Virgin Islanders | 0.0 /100 | #320 | Tragic 22.0% |
| Cajuns | 0.0 /100 | #321 | Tragic 22.2% |
| Immigrants | Dominica | 0.0 /100 | #322 | Tragic 22.2% |
| Hondurans | 0.0 /100 | #323 | Tragic 22.3% |
| Immigrants | Congo | 0.0 /100 | #324 | Tragic 22.4% |
| Central American Indians | 0.0 /100 | #325 | Tragic 22.5% |
| Paiute | 0.0 /100 | #326 | Tragic 22.8% |
| Immigrants | Honduras | 0.0 /100 | #327 | Tragic 22.8% |
| Pueblo | 0.0 /100 | #328 | Tragic 23.5% |
| Natives/Alaskans | 0.0 /100 | #329 | Tragic 24.0% |
| Colville | 0.0 /100 | #330 | Tragic 24.1% |
| Dominicans | 0.0 /100 | #331 | Tragic 24.2% |
| Immigrants | Dominican Republic | 0.0 /100 | #332 | Tragic 24.3% |
Demographics Similar to Sierra Leoneans by Child Poverty Among Boys Under 16
In terms of child poverty among boys under 16, the demographic groups most similar to Sierra Leoneans are Iraqi (17.7%, a difference of 0.080%), Japanese (17.7%, a difference of 0.10%), Moroccan (17.7%, a difference of 0.13%), Immigrants from Cambodia (17.8%, a difference of 0.13%), and Osage (17.7%, a difference of 0.22%).
| Demographics | Rating | Rank | Child Poverty Among Boys Under 16 |
| Aleuts | 6.6 /100 | #212 | Tragic 17.7% |
| Immigrants | Eastern Africa | 6.0 /100 | #213 | Tragic 17.7% |
| Panamanians | 5.9 /100 | #214 | Tragic 17.7% |
| Osage | 5.8 /100 | #215 | Tragic 17.7% |
| Moroccans | 5.6 /100 | #216 | Tragic 17.7% |
| Japanese | 5.5 /100 | #217 | Tragic 17.7% |
| Iraqis | 5.5 /100 | #218 | Tragic 17.7% |
| Sierra Leoneans | 5.3 /100 | #219 | Tragic 17.8% |
| Immigrants | Cambodia | 5.1 /100 | #220 | Tragic 17.8% |
| Immigrants | Panama | 4.3 /100 | #221 | Tragic 17.9% |
| Pennsylvania Germans | 3.9 /100 | #222 | Tragic 17.9% |
| Cubans | 3.8 /100 | #223 | Tragic 17.9% |
| Nepalese | 3.2 /100 | #224 | Tragic 18.0% |
| Inupiat | 2.7 /100 | #225 | Tragic 18.1% |
| Immigrants | Africa | 2.6 /100 | #226 | Tragic 18.1% |