Central American Indian vs Immigrants from Kuwait Seniors Poverty Over the Age of 65

COMPARE

Central American Indian
Race
Ancestry
AfghanAfricanAlaska NativeAlaskan AthabascanAlbanianAleutAlsatianAmericanApacheArabArapahoArgentineanArmenianAssyrian/Chaldean/SyriacAustralianAustrianBahamianBangladeshiBarbadianBasqueBelgianBelizeanBermudanBhutaneseBlackfeetBolivianBrazilianBritishBritish West IndianBulgarianBurmeseCajunCambodianCanadianCape VerdeanCarpatho RusynCelticCentral AmericanCentral American IndianCherokeeCheyenneChickasawChileanChineseChippewaChoctawColombianColvilleComancheCosta RicanCreeCreekCroatianCrowCubanCypriotCzechCzechoslovakianDanishDelawareDominicanDutchDutch West IndianEastern EuropeanEcuadorianEgyptianEnglishEstonianEthiopianEuropeanFijianFilipinoFinnishFrenchFrench American IndianFrench CanadianGermanGerman RussianGhanaianGreekGuamanian/ChamorroGuatemalanGuyaneseHaitianHmongHonduranHopiHoumaHungarianIcelanderIndian (Asian)IndonesianInupiatIranianIraqiIrishIroquoisIsraeliItalianJamaicanJapaneseJordanianKenyanKiowaKoreanLaotianLatvianLebaneseLiberianLithuanianLumbeeLuxembourgerMacedonianMalaysianMalteseMarshalleseMenomineeMexicanMexican American IndianMongolianMoroccanNative HawaiianNavajoNepaleseNew ZealanderNicaraguanNigerianNorthern EuropeanNorwegianOkinawanOsageOttawaPaiutePakistaniPalestinianPanamanianParaguayanPennsylvania GermanPeruvianPimaPolishPortuguesePotawatomiPuebloPuerto RicanPuget Sound SalishRomanianRussianSalvadoranSamoanScandinavianScotch-IrishScottishSeminoleSenegaleseSerbianShoshoneSierra LeoneanSiouxSlavicSlovakSloveneSomaliSouth AfricanSouth AmericanSouth American IndianSoviet UnionSpaniardSpanishSpanish AmericanSpanish American IndianSri LankanSubsaharan AfricanSudaneseSwedishSwissSyrianTaiwaneseThaiTlingit-HaidaTohono O'OdhamTonganTrinidadian and TobagonianTsimshianTurkishU.S. Virgin IslanderUgandanUkrainianUruguayanUteVenezuelanVietnameseWelshWest IndianYakamaYaquiYugoslavianYumanYup'ikZimbabwean
Immigration
NonimmigrantsImmigrantsAfghanistanAfricaAlbaniaArgentinaArmeniaAsiaAustraliaAustriaBahamasBangladeshBarbadosBelarusBelgiumBelizeBoliviaBosnia and HerzegovinaBrazilBulgariaBurma/MyanmarCabo VerdeCambodiaCameroonCanadaCaribbeanCentral AmericaChileChinaColombiaCongoCosta RicaCroatiaCubaCzechoslovakiaDenmarkDominicaDominican RepublicEastern AfricaEastern AsiaEastern EuropeEcuadorEgyptEl SalvadorEnglandEritreaEthiopiaEuropeFijiFranceGermanyGhanaGreeceGrenadaGuatemalaGuyanaHaitiHondurasHong KongHungaryIndiaIndonesiaIranIraqIrelandIsraelItalyJamaicaJapanJordanKazakhstanKenyaKoreaLaosLatin AmericaLatviaLebanonLiberiaLithuaniaMalaysiaMexicoMicronesiaMiddle AfricaMoldovaMoroccoNepalNetherlandsNicaraguaNigeriaNorth AmericaNorth MacedoniaNorthern AfricaNorthern EuropeNorwayOceaniaPakistanPanamaPeruPhilippinesPolandPortugalRomaniaRussiaSaudi ArabiaScotlandSenegalSerbiaSierra LeoneSingaporeSomaliaSouth AfricaSouth AmericaSouth Central AsiaSouth Eastern AsiaSouthern EuropeSpainSri LankaSt. Vincent and the GrenadinesSudanSwedenSwitzerlandSyriaTaiwanThailandTrinidad and TobagoTurkeyUgandaUkraineUruguayUzbekistanVenezuelaVietnamWest IndiesWestern AfricaWestern AsiaWestern EuropeYemenZaireZimbabweAzores
Immigrants from Kuwait
Race
Ancestry
AfghanAfricanAlaska NativeAlaskan AthabascanAlbanianAleutAlsatianAmericanApacheArabArapahoArgentineanArmenianAssyrian/Chaldean/SyriacAustralianAustrianBahamianBangladeshiBarbadianBasqueBelgianBelizeanBermudanBhutaneseBlackfeetBolivianBrazilianBritishBritish West IndianBulgarianBurmeseCajunCambodianCanadianCape VerdeanCarpatho RusynCelticCentral AmericanCherokeeCheyenneChickasawChileanChineseChippewaChoctawColombianColvilleComancheCosta RicanCreeCreekCroatianCrowCubanCypriotCzechCzechoslovakianDanishDelawareDominicanDutchDutch West IndianEastern EuropeanEcuadorianEgyptianEnglishEstonianEthiopianEuropeanFijianFilipinoFinnishFrenchFrench American IndianFrench CanadianGermanGerman RussianGhanaianGreekGuamanian/ChamorroGuatemalanGuyaneseHaitianHmongHonduranHopiHoumaHungarianIcelanderIndian (Asian)IndonesianInupiatIranianIraqiIrishIroquoisIsraeliItalianJamaicanJapaneseJordanianKenyanKiowaKoreanLaotianLatvianLebaneseLiberianLithuanianLumbeeLuxembourgerMacedonianMalaysianMalteseMarshalleseMenomineeMexicanMexican American IndianMongolianMoroccanNative HawaiianNavajoNepaleseNew ZealanderNicaraguanNigerianNorthern EuropeanNorwegianOkinawanOsageOttawaPaiutePakistaniPalestinianPanamanianParaguayanPennsylvania GermanPeruvianPimaPolishPortuguesePotawatomiPuebloPuerto RicanPuget Sound SalishRomanianRussianSalvadoranSamoanScandinavianScotch-IrishScottishSeminoleSenegaleseSerbianShoshoneSierra LeoneanSiouxSlavicSlovakSloveneSomaliSouth AfricanSouth AmericanSouth American IndianSoviet UnionSpaniardSpanishSpanish AmericanSpanish American IndianSri LankanSubsaharan AfricanSudaneseSwedishSwissSyrianTaiwaneseThaiTlingit-HaidaTohono O'OdhamTonganTrinidadian and TobagonianTsimshianTurkishU.S. Virgin IslanderUgandanUkrainianUruguayanUteVenezuelanVietnameseWelshWest IndianYakamaYaquiYugoslavianYumanYup'ikZimbabwean
Immigration
NonimmigrantsImmigrantsAfghanistanAfricaAlbaniaArgentinaArmeniaAsiaAustraliaAustriaBahamasBangladeshBarbadosBelarusBelgiumBelizeBoliviaBosnia and HerzegovinaBrazilBulgariaBurma/MyanmarCabo VerdeCambodiaCameroonCanadaCaribbeanCentral AmericaChileChinaColombiaCongoCosta RicaCroatiaCubaCzechoslovakiaDenmarkDominicaDominican RepublicEastern AfricaEastern AsiaEastern EuropeEcuadorEgyptEl SalvadorEnglandEritreaEthiopiaEuropeFijiFranceGermanyGhanaGreeceGrenadaGuatemalaGuyanaHaitiHondurasHong KongHungaryIndiaIndonesiaIranIraqIrelandIsraelItalyJamaicaJapanJordanKazakhstanKenyaKoreaKuwaitLaosLatin AmericaLatviaLebanonLiberiaLithuaniaMalaysiaMexicoMicronesiaMiddle AfricaMoldovaMoroccoNepalNetherlandsNicaraguaNigeriaNorth AmericaNorth MacedoniaNorthern AfricaNorthern EuropeNorwayOceaniaPakistanPanamaPeruPhilippinesPolandPortugalRomaniaRussiaSaudi ArabiaScotlandSenegalSerbiaSierra LeoneSingaporeSomaliaSouth AfricaSouth AmericaSouth Central AsiaSouth Eastern AsiaSouthern EuropeSpainSri LankaSt. Vincent and the GrenadinesSudanSwedenSwitzerlandSyriaTaiwanThailandTrinidad and TobagoTurkeyUgandaUkraineUruguayUzbekistanVenezuelaVietnamWest IndiesWestern AfricaWestern AsiaWestern EuropeYemenZaireZimbabweAzores
Seniors Poverty Over the Age of 65
Income
Poverty
Unemployment
Labor Participation
Family Structure
Vehicle Availability
Education Level
Disability

Seniors Poverty Over the Age of 65 Comparison

Central American Indians

Immigrants from Kuwait

Tragic
Exceptional
15.1%
SENIORS POVERTY OVER THE AGE OF 65
0.0/ 100
METRIC RATING
325th/ 347
METRIC RANK
10.2%
SENIORS POVERTY OVER THE AGE OF 65
95.5/ 100
METRIC RATING
98th/ 347
METRIC RANK

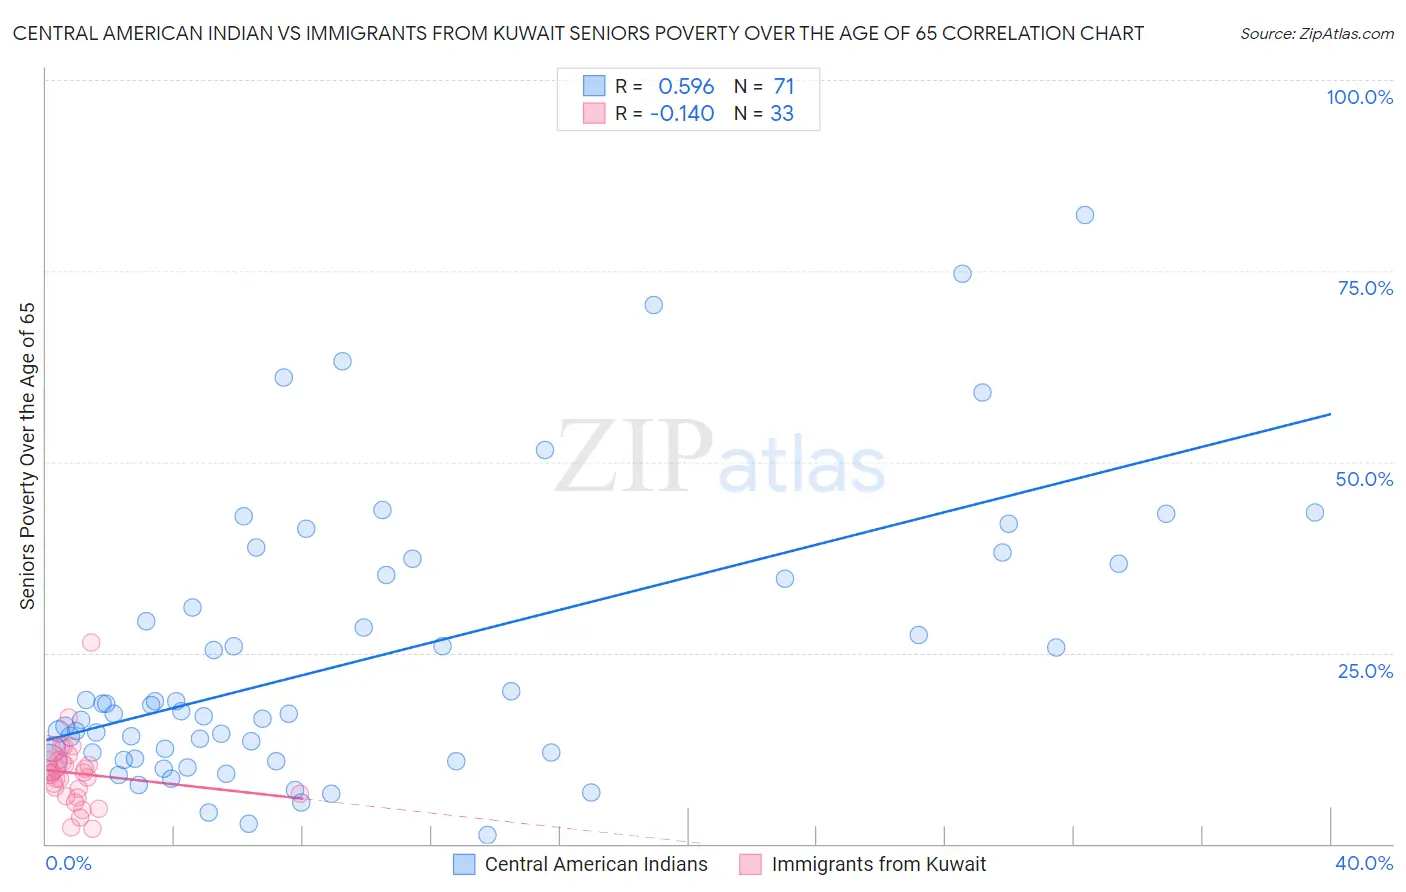
Central American Indian vs Immigrants from Kuwait Seniors Poverty Over the Age of 65 Correlation Chart

The statistical analysis conducted on geographies consisting of 325,391,809 people shows a substantial positive correlation between the proportion of Central American Indians and poverty level among seniors over the age of 65 in the United States with a correlation coefficient (R) of 0.596 and weighted average of 15.1%. Similarly, the statistical analysis conducted on geographies consisting of 136,807,849 people shows a poor negative correlation between the proportion of Immigrants from Kuwait and poverty level among seniors over the age of 65 in the United States with a correlation coefficient (R) of -0.140 and weighted average of 10.2%, a difference of 48.0%.
Central American Indian vs Immigrants from Kuwait Seniors Poverty Over the Age of 65

Seniors Poverty Over the Age of 65 Correlation Summary

MeasurementCentral American IndianImmigrants from Kuwait
Minimum1.1%1.9%
Maximum82.2%26.3%
Range81.1%24.3%
Mean24.1%9.2%
Median17.1%9.3%
Interquartile 25% (IQ1)11.2%6.4%
Interquartile 75% (IQ3)35.2%10.9%
Interquartile Range (IQR)24.1%4.5%
Standard Deviation (Sample)18.1%4.5%
Standard Deviation (Population)18.0%4.4%

Similar Demographics by Seniors Poverty Over the Age of 65

Demographics Similar to Central American Indians by Seniors Poverty Over the Age of 65

In terms of seniors poverty over the age of 65, the demographic groups most similar to Central American Indians are Nicaraguan (15.0%, a difference of 0.59%), Immigrants from Armenia (15.2%, a difference of 0.60%), Crow (15.2%, a difference of 0.86%), Sioux (15.3%, a difference of 1.4%), and Yakama (14.8%, a difference of 2.0%).
DemographicsRating | RankSeniors Poverty Over the Age of 65
Immigrants | Honduras
0.0
/100
|
#318
Tragic
14.5%
Cape Verdeans
0.0
/100
|
#319
Tragic
14.7%
Immigrants | Haiti
0.0
/100
|
#320
Tragic
14.7%
Houma
0.0
/100
|
#321
Tragic
14.7%
Immigrants | Barbados
0.0
/100
|
#322
Tragic
14.8%
Yakama
0.0
/100
|
#323
Tragic
14.8%
Nicaraguans
0.0
/100
|
#324
Tragic
15.0%
Central American Indians
0.0
/100
|
#325
Tragic
15.1%
Immigrants | Armenia
0.0
/100
|
#326
Tragic
15.2%
Crow
0.0
/100
|
#327
Tragic
15.2%
Sioux
0.0
/100
|
#328
Tragic
15.3%
Immigrants | Dominica
0.0
/100
|
#329
Tragic
15.5%
Immigrants | St. Vincent and the Grenadines
0.0
/100
|
#330
Tragic
15.5%
British West Indians
0.0
/100
|
#331
Tragic
15.6%
Immigrants | Grenada
0.0
/100
|
#332
Tragic
15.8%

Demographics Similar to Immigrants from Kuwait by Seniors Poverty Over the Age of 65

In terms of seniors poverty over the age of 65, the demographic groups most similar to Immigrants from Kuwait are Cypriot (10.2%, a difference of 0.0%), Marshallese (10.2%, a difference of 0.070%), Immigrants from Pakistan (10.2%, a difference of 0.16%), Basque (10.2%, a difference of 0.24%), and Immigrants from Jordan (10.2%, a difference of 0.39%).
DemographicsRating | RankSeniors Poverty Over the Age of 65
Puget Sound Salish
96.9
/100
|
#91
Exceptional
10.1%
Immigrants | Singapore
96.9
/100
|
#92
Exceptional
10.1%
Immigrants | Sweden
96.7
/100
|
#93
Exceptional
10.1%
Immigrants | Germany
96.7
/100
|
#94
Exceptional
10.1%
Immigrants | Japan
96.3
/100
|
#95
Exceptional
10.1%
Basques
95.9
/100
|
#96
Exceptional
10.2%
Immigrants | Pakistan
95.7
/100
|
#97
Exceptional
10.2%
Immigrants | Kuwait
95.5
/100
|
#98
Exceptional
10.2%
Cypriots
95.5
/100
|
#99
Exceptional
10.2%
Marshallese
95.3
/100
|
#100
Exceptional
10.2%
Immigrants | Jordan
94.7
/100
|
#101
Exceptional
10.2%
Delaware
94.5
/100
|
#102
Exceptional
10.2%
Icelanders
94.4
/100
|
#103
Exceptional
10.3%
South Africans
94.3
/100
|
#104
Exceptional
10.3%
Aleuts
94.1
/100
|
#105
Exceptional
10.3%