Cape Verdean vs Bermudan Child Poverty Under the Age of 16
COMPARE
Cape Verdean
Bermudan
Child Poverty Under the Age of 16
Child Poverty Under the Age of 16 Comparison
Cape Verdeans
Bermudans
18.7%
CHILD POVERTY UNDER THE AGE OF 16
0.6/ 100
METRIC RATING
244th/ 347
METRIC RANK
18.0%
CHILD POVERTY UNDER THE AGE OF 16
2.6/ 100
METRIC RATING
226th/ 347
METRIC RANK
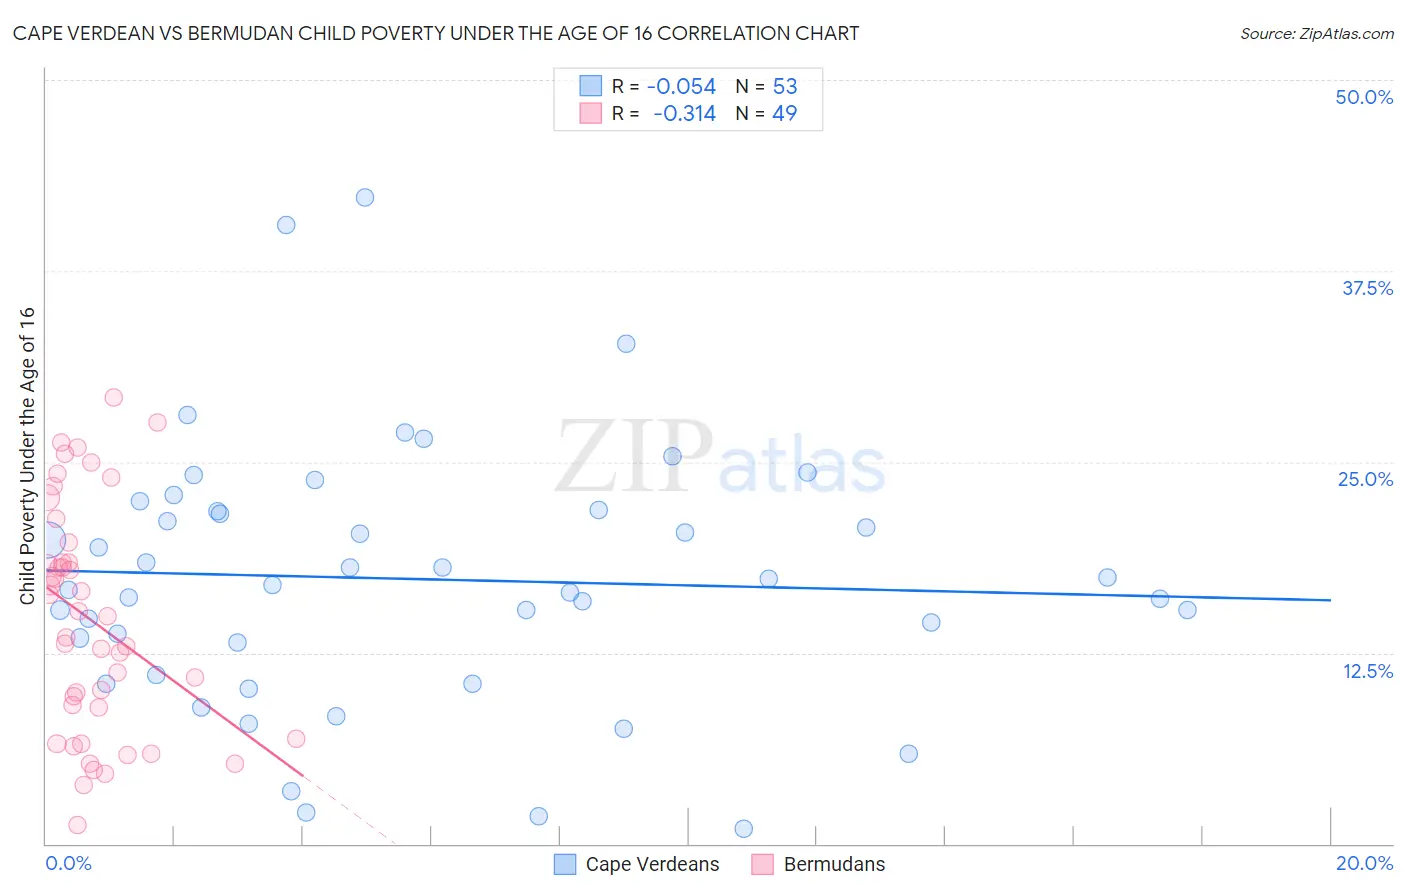
Cape Verdean vs Bermudan Child Poverty Under the Age of 16 Correlation Chart
The statistical analysis conducted on geographies consisting of 107,159,095 people shows a slight negative correlation between the proportion of Cape Verdeans and poverty level among children under the age of 16 in the United States with a correlation coefficient (R) of -0.054 and weighted average of 18.7%. Similarly, the statistical analysis conducted on geographies consisting of 55,690,108 people shows a mild negative correlation between the proportion of Bermudans and poverty level among children under the age of 16 in the United States with a correlation coefficient (R) of -0.314 and weighted average of 18.0%, a difference of 4.1%.
Child Poverty Under the Age of 16 Correlation Summary
| Measurement | Cape Verdean | Bermudan |
| Minimum | 0.98% | 1.2% |
| Maximum | 42.3% | 29.2% |
| Range | 41.3% | 28.0% |
| Mean | 17.3% | 14.6% |
| Median | 17.0% | 14.9% |
| Interquartile 25% (IQ1) | 12.1% | 7.9% |
| Interquartile 75% (IQ3) | 21.8% | 19.1% |
| Interquartile Range (IQR) | 9.7% | 11.1% |
| Standard Deviation (Sample) | 8.5% | 7.4% |
| Standard Deviation (Population) | 8.4% | 7.3% |
Demographics Similar to Cape Verdeans and Bermudans by Child Poverty Under the Age of 16
In terms of child poverty under the age of 16, the demographic groups most similar to Cape Verdeans are Immigrants from Cuba (18.7%, a difference of 0.070%), Immigrants from Laos (18.7%, a difference of 0.20%), Alsatian (18.6%, a difference of 0.32%), Shoshone (18.8%, a difference of 0.65%), and Ghanaian (18.6%, a difference of 0.78%). Similarly, the demographic groups most similar to Bermudans are Nonimmigrants (17.9%, a difference of 0.070%), Immigrants from Africa (18.0%, a difference of 0.18%), Immigrants from Micronesia (18.0%, a difference of 0.34%), Marshallese (18.1%, a difference of 1.1%), and Nepalese (18.2%, a difference of 1.1%).
| Demographics | Rating | Rank | Child Poverty Under the Age of 16 |
| Immigrants | Nonimmigrants | 2.7 /100 | #225 | Tragic 17.9% |
| Bermudans | 2.6 /100 | #226 | Tragic 18.0% |
| Immigrants | Africa | 2.5 /100 | #227 | Tragic 18.0% |
| Immigrants | Micronesia | 2.3 /100 | #228 | Tragic 18.0% |
| Marshallese | 1.8 /100 | #229 | Tragic 18.1% |
| Nepalese | 1.7 /100 | #230 | Tragic 18.2% |
| Nicaraguans | 1.7 /100 | #231 | Tragic 18.2% |
| Americans | 1.2 /100 | #232 | Tragic 18.3% |
| Fijians | 1.1 /100 | #233 | Tragic 18.4% |
| Immigrants | Nigeria | 1.0 /100 | #234 | Tragic 18.4% |
| Nigerians | 1.0 /100 | #235 | Tragic 18.4% |
| Cree | 0.9 /100 | #236 | Tragic 18.5% |
| Sudanese | 0.9 /100 | #237 | Tragic 18.5% |
| Immigrants | Eritrea | 0.8 /100 | #238 | Tragic 18.5% |
| Immigrants | Sudan | 0.8 /100 | #239 | Tragic 18.5% |
| Ghanaians | 0.8 /100 | #240 | Tragic 18.6% |
| Alsatians | 0.7 /100 | #241 | Tragic 18.6% |
| Immigrants | Laos | 0.6 /100 | #242 | Tragic 18.7% |
| Immigrants | Cuba | 0.6 /100 | #243 | Tragic 18.7% |
| Cape Verdeans | 0.6 /100 | #244 | Tragic 18.7% |
| Shoshone | 0.5 /100 | #245 | Tragic 18.8% |