Bulgarian vs Cypriot Seniors Poverty Over the Age of 75
COMPARE
Bulgarian
Cypriot
Seniors Poverty Over the Age of 75
Seniors Poverty Over the Age of 75 Comparison
Bulgarians
Cypriots
10.7%
SENIORS POVERTY OVER THE AGE OF 75
99.8/ 100
METRIC RATING
26th/ 347
METRIC RANK
12.0%
SENIORS POVERTY OVER THE AGE OF 75
67.3/ 100
METRIC RATING
150th/ 347
METRIC RANK
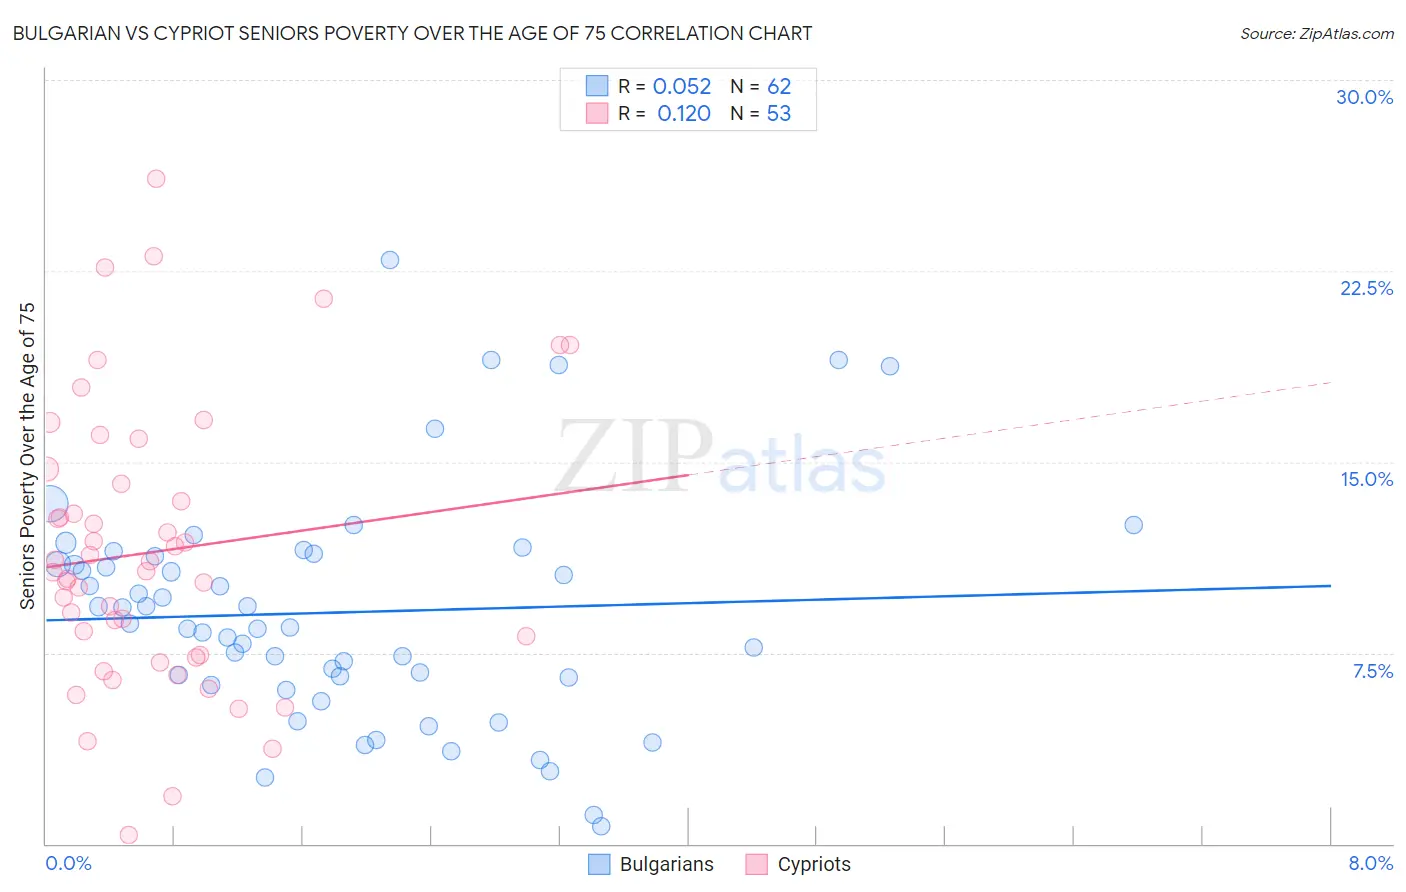
Bulgarian vs Cypriot Seniors Poverty Over the Age of 75 Correlation Chart
The statistical analysis conducted on geographies consisting of 204,615,916 people shows a slight positive correlation between the proportion of Bulgarians and poverty level among seniors over the age of 75 in the United States with a correlation coefficient (R) of 0.052 and weighted average of 10.7%. Similarly, the statistical analysis conducted on geographies consisting of 61,675,074 people shows a poor positive correlation between the proportion of Cypriots and poverty level among seniors over the age of 75 in the United States with a correlation coefficient (R) of 0.120 and weighted average of 12.0%, a difference of 12.7%.
Seniors Poverty Over the Age of 75 Correlation Summary
| Measurement | Bulgarian | Cypriot |
| Minimum | 0.68% | 0.34% |
| Maximum | 23.0% | 26.1% |
| Range | 22.3% | 25.8% |
| Mean | 9.1% | 11.5% |
| Median | 8.6% | 10.7% |
| Interquartile 25% (IQ1) | 6.5% | 7.4% |
| Interquartile 75% (IQ3) | 11.3% | 14.4% |
| Interquartile Range (IQR) | 4.8% | 7.0% |
| Standard Deviation (Sample) | 4.5% | 5.5% |
| Standard Deviation (Population) | 4.5% | 5.4% |
Similar Demographics by Seniors Poverty Over the Age of 75
Demographics Similar to Bulgarians by Seniors Poverty Over the Age of 75
In terms of seniors poverty over the age of 75, the demographic groups most similar to Bulgarians are Northern European (10.7%, a difference of 0.27%), Irish (10.7%, a difference of 0.33%), Assyrian/Chaldean/Syriac (10.7%, a difference of 0.48%), Swiss (10.7%, a difference of 0.56%), and Menominee (10.6%, a difference of 0.58%).
| Demographics | Rating | Rank | Seniors Poverty Over the Age of 75 |
| Immigrants | Scotland | 99.9 /100 | #19 | Exceptional 10.5% |
| Czechs | 99.9 /100 | #20 | Exceptional 10.5% |
| Slovenes | 99.9 /100 | #21 | Exceptional 10.6% |
| Bhutanese | 99.8 /100 | #22 | Exceptional 10.6% |
| Lithuanians | 99.8 /100 | #23 | Exceptional 10.6% |
| Poles | 99.8 /100 | #24 | Exceptional 10.6% |
| Menominee | 99.8 /100 | #25 | Exceptional 10.6% |
| Bulgarians | 99.8 /100 | #26 | Exceptional 10.7% |
| Northern Europeans | 99.8 /100 | #27 | Exceptional 10.7% |
| Irish | 99.8 /100 | #28 | Exceptional 10.7% |
| Assyrians/Chaldeans/Syriacs | 99.8 /100 | #29 | Exceptional 10.7% |
| Swiss | 99.7 /100 | #30 | Exceptional 10.7% |
| Marshallese | 99.7 /100 | #31 | Exceptional 10.7% |
| British | 99.7 /100 | #32 | Exceptional 10.7% |
| Puget Sound Salish | 99.7 /100 | #33 | Exceptional 10.8% |
Demographics Similar to Cypriots by Seniors Poverty Over the Age of 75
In terms of seniors poverty over the age of 75, the demographic groups most similar to Cypriots are Asian (12.0%, a difference of 0.010%), Immigrants from Zaire (12.0%, a difference of 0.030%), Cherokee (12.0%, a difference of 0.14%), Immigrants from Latvia (12.0%, a difference of 0.17%), and Immigrants from Korea (12.0%, a difference of 0.17%).
| Demographics | Rating | Rank | Seniors Poverty Over the Age of 75 |
| Americans | 71.0 /100 | #143 | Good 12.0% |
| Hmong | 70.8 /100 | #144 | Good 12.0% |
| Immigrants | Belgium | 70.8 /100 | #145 | Good 12.0% |
| Bangladeshis | 70.4 /100 | #146 | Good 12.0% |
| Immigrants | Latvia | 69.1 /100 | #147 | Good 12.0% |
| Immigrants | Zaire | 67.6 /100 | #148 | Good 12.0% |
| Asians | 67.4 /100 | #149 | Good 12.0% |
| Cypriots | 67.3 /100 | #150 | Good 12.0% |
| Cherokee | 65.8 /100 | #151 | Good 12.0% |
| Immigrants | Korea | 65.5 /100 | #152 | Good 12.0% |
| Immigrants | Turkey | 64.7 /100 | #153 | Good 12.0% |
| Cambodians | 64.0 /100 | #154 | Good 12.0% |
| Indonesians | 62.6 /100 | #155 | Good 12.1% |
| Immigrants | Burma/Myanmar | 62.3 /100 | #156 | Good 12.1% |
| Immigrants | Sudan | 61.7 /100 | #157 | Good 12.1% |