British West Indian vs Argentinean Seniors Poverty Over the Age of 75
COMPARE
British West Indian
Argentinean
Seniors Poverty Over the Age of 75
Seniors Poverty Over the Age of 75 Comparison
British West Indians
Argentineans
17.4%
SENIORS POVERTY OVER THE AGE OF 75
0.0/ 100
METRIC RATING
330th/ 347
METRIC RANK
13.4%
SENIORS POVERTY OVER THE AGE OF 75
0.7/ 100
METRIC RATING
240th/ 347
METRIC RANK
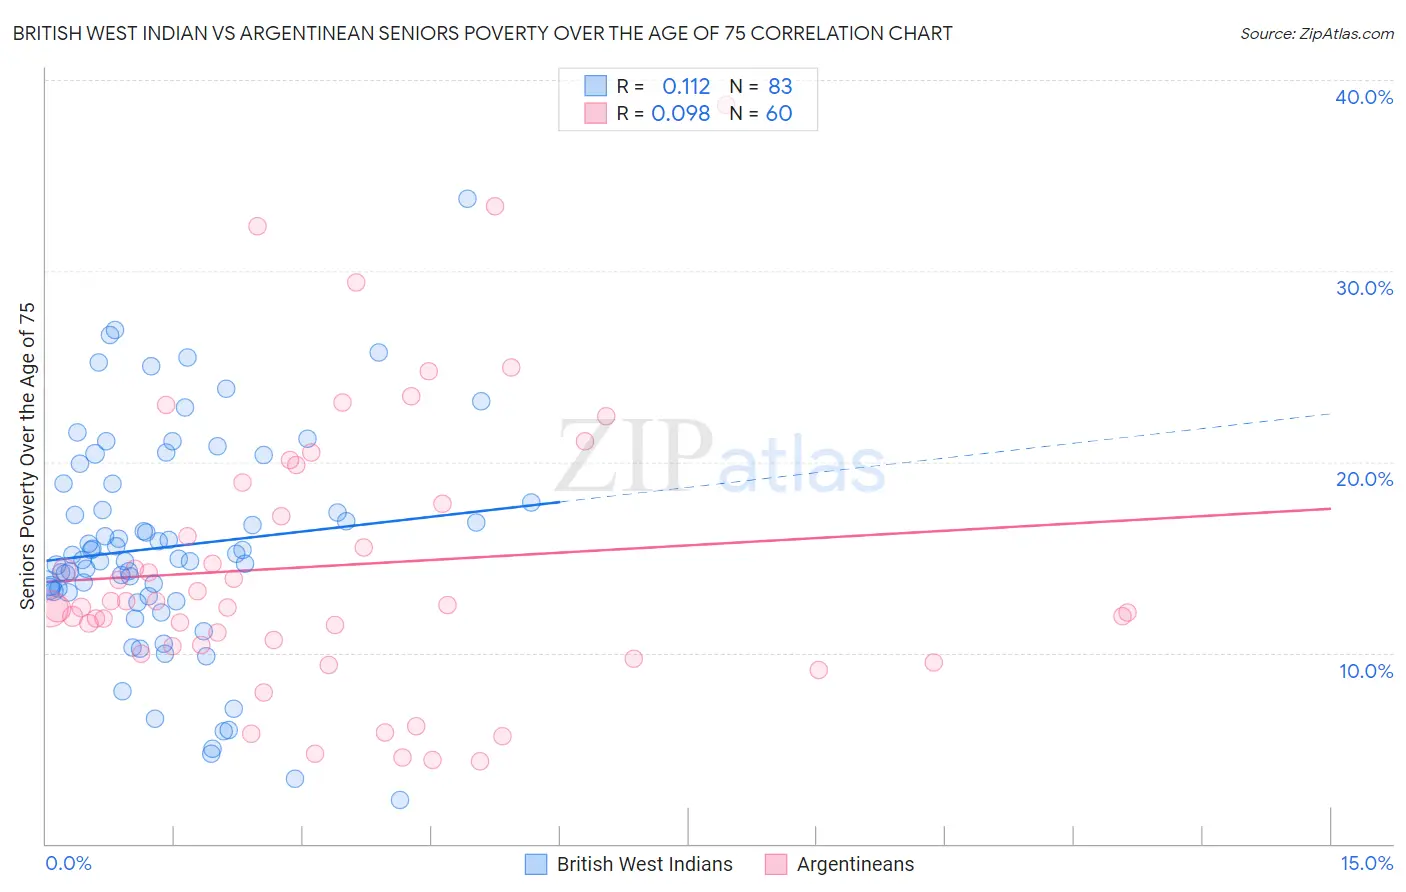
British West Indian vs Argentinean Seniors Poverty Over the Age of 75 Correlation Chart
The statistical analysis conducted on geographies consisting of 151,930,875 people shows a poor positive correlation between the proportion of British West Indians and poverty level among seniors over the age of 75 in the United States with a correlation coefficient (R) of 0.112 and weighted average of 17.4%. Similarly, the statistical analysis conducted on geographies consisting of 294,829,039 people shows a slight positive correlation between the proportion of Argentineans and poverty level among seniors over the age of 75 in the United States with a correlation coefficient (R) of 0.098 and weighted average of 13.4%, a difference of 29.7%.
Seniors Poverty Over the Age of 75 Correlation Summary
| Measurement | British West Indian | Argentinean |
| Minimum | 2.3% | 4.3% |
| Maximum | 33.8% | 38.7% |
| Range | 31.5% | 34.4% |
| Mean | 15.6% | 14.6% |
| Median | 14.9% | 12.5% |
| Interquartile 25% (IQ1) | 13.2% | 10.4% |
| Interquartile 75% (IQ3) | 18.8% | 18.3% |
| Interquartile Range (IQR) | 5.7% | 8.0% |
| Standard Deviation (Sample) | 5.7% | 7.4% |
| Standard Deviation (Population) | 5.7% | 7.3% |
Similar Demographics by Seniors Poverty Over the Age of 75
Demographics Similar to British West Indians by Seniors Poverty Over the Age of 75
In terms of seniors poverty over the age of 75, the demographic groups most similar to British West Indians are Immigrants from Armenia (17.5%, a difference of 0.26%), Immigrants from St. Vincent and the Grenadines (17.5%, a difference of 0.52%), Immigrants from Nicaragua (17.6%, a difference of 0.99%), Immigrants from Dominica (17.0%, a difference of 2.4%), and Immigrants from Grenada (17.8%, a difference of 2.5%).
| Demographics | Rating | Rank | Seniors Poverty Over the Age of 75 |
| Central American Indians | 0.0 /100 | #323 | Tragic 16.5% |
| Immigrants | Uzbekistan | 0.0 /100 | #324 | Tragic 16.5% |
| Nicaraguans | 0.0 /100 | #325 | Tragic 16.6% |
| Pueblo | 0.0 /100 | #326 | Tragic 16.7% |
| Sioux | 0.0 /100 | #327 | Tragic 16.8% |
| Cape Verdeans | 0.0 /100 | #328 | Tragic 16.8% |
| Immigrants | Dominica | 0.0 /100 | #329 | Tragic 17.0% |
| British West Indians | 0.0 /100 | #330 | Tragic 17.4% |
| Immigrants | Armenia | 0.0 /100 | #331 | Tragic 17.5% |
| Immigrants | St. Vincent and the Grenadines | 0.0 /100 | #332 | Tragic 17.5% |
| Immigrants | Nicaragua | 0.0 /100 | #333 | Tragic 17.6% |
| Immigrants | Grenada | 0.0 /100 | #334 | Tragic 17.8% |
| Cubans | 0.0 /100 | #335 | Tragic 18.0% |
| Immigrants | Caribbean | 0.0 /100 | #336 | Tragic 18.2% |
| Yakama | 0.0 /100 | #337 | Tragic 18.3% |
Demographics Similar to Argentineans by Seniors Poverty Over the Age of 75
In terms of seniors poverty over the age of 75, the demographic groups most similar to Argentineans are Immigrants from Russia (13.4%, a difference of 0.14%), Immigrants from Somalia (13.5%, a difference of 0.24%), Dutch West Indian (13.5%, a difference of 0.26%), Panamanian (13.4%, a difference of 0.31%), and Peruvian (13.4%, a difference of 0.41%).
| Demographics | Rating | Rank | Seniors Poverty Over the Age of 75 |
| Immigrants | Costa Rica | 1.3 /100 | #233 | Tragic 13.3% |
| Immigrants | Israel | 1.1 /100 | #234 | Tragic 13.3% |
| Japanese | 0.9 /100 | #235 | Tragic 13.3% |
| Moroccans | 0.9 /100 | #236 | Tragic 13.3% |
| Alaskan Athabascans | 0.8 /100 | #237 | Tragic 13.4% |
| Peruvians | 0.8 /100 | #238 | Tragic 13.4% |
| Panamanians | 0.8 /100 | #239 | Tragic 13.4% |
| Argentineans | 0.7 /100 | #240 | Tragic 13.4% |
| Immigrants | Russia | 0.6 /100 | #241 | Tragic 13.4% |
| Immigrants | Somalia | 0.6 /100 | #242 | Tragic 13.5% |
| Dutch West Indians | 0.6 /100 | #243 | Tragic 13.5% |
| Spanish Americans | 0.5 /100 | #244 | Tragic 13.5% |
| Uruguayans | 0.5 /100 | #245 | Tragic 13.5% |
| Immigrants | Cambodia | 0.4 /100 | #246 | Tragic 13.6% |
| Immigrants | Ukraine | 0.3 /100 | #247 | Tragic 13.6% |