Blackfeet vs Swiss Poverty
COMPARE
Blackfeet
Swiss
Poverty
Poverty Comparison
Blackfeet
Swiss
15.2%
POVERTY
0.0/ 100
METRIC RATING
294th/ 347
METRIC RANK
11.2%
POVERTY
97.7/ 100
METRIC RATING
64th/ 347
METRIC RANK
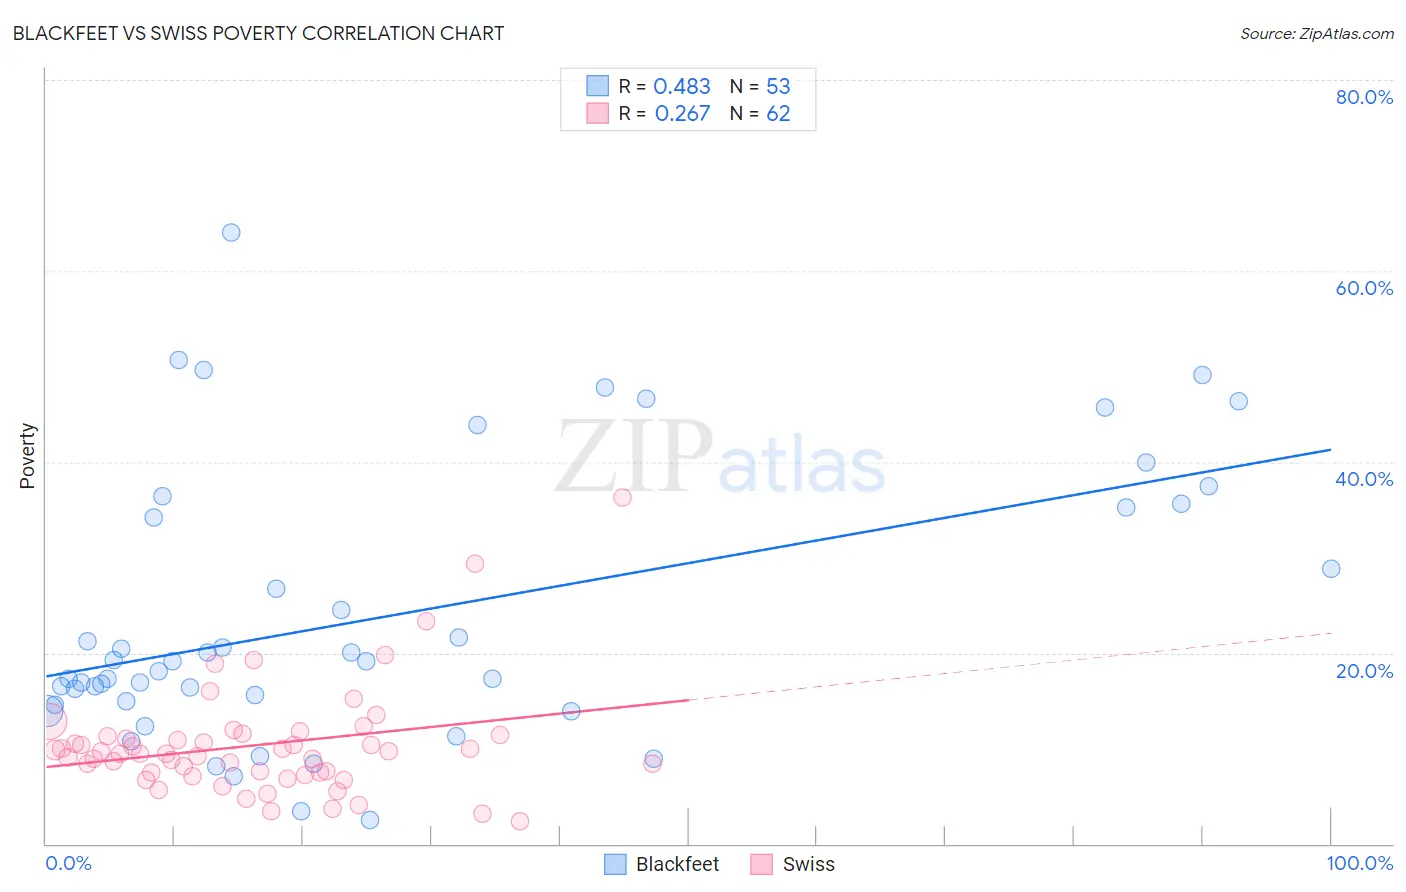
Blackfeet vs Swiss Poverty Correlation Chart
The statistical analysis conducted on geographies consisting of 309,474,623 people shows a moderate positive correlation between the proportion of Blackfeet and poverty level in the United States with a correlation coefficient (R) of 0.483 and weighted average of 15.2%. Similarly, the statistical analysis conducted on geographies consisting of 464,705,995 people shows a weak positive correlation between the proportion of Swiss and poverty level in the United States with a correlation coefficient (R) of 0.267 and weighted average of 11.2%, a difference of 35.6%.
Poverty Correlation Summary
| Measurement | Blackfeet | Swiss |
| Minimum | 2.5% | 2.3% |
| Maximum | 64.1% | 36.2% |
| Range | 61.6% | 33.9% |
| Mean | 23.9% | 10.3% |
| Median | 19.1% | 9.5% |
| Interquartile 25% (IQ1) | 14.7% | 7.4% |
| Interquartile 75% (IQ3) | 35.4% | 11.3% |
| Interquartile Range (IQR) | 20.7% | 3.9% |
| Standard Deviation (Sample) | 14.4% | 5.7% |
| Standard Deviation (Population) | 14.3% | 5.7% |
Similar Demographics by Poverty
Demographics Similar to Blackfeet by Poverty
In terms of poverty, the demographic groups most similar to Blackfeet are Guatemalan (15.3%, a difference of 0.42%), Hispanic or Latino (15.3%, a difference of 0.43%), Indonesian (15.1%, a difference of 0.44%), Immigrants from Zaire (15.1%, a difference of 0.44%), and Immigrants from Bangladesh (15.3%, a difference of 0.47%).
| Demographics | Rating | Rank | Poverty |
| Inupiat | 0.0 /100 | #287 | Tragic 15.1% |
| Yaqui | 0.0 /100 | #288 | Tragic 15.1% |
| Immigrants | Belize | 0.0 /100 | #289 | Tragic 15.1% |
| Mexicans | 0.0 /100 | #290 | Tragic 15.1% |
| Immigrants | Cabo Verde | 0.0 /100 | #291 | Tragic 15.1% |
| Indonesians | 0.0 /100 | #292 | Tragic 15.1% |
| Immigrants | Zaire | 0.0 /100 | #293 | Tragic 15.1% |
| Blackfeet | 0.0 /100 | #294 | Tragic 15.2% |
| Guatemalans | 0.0 /100 | #295 | Tragic 15.3% |
| Hispanics or Latinos | 0.0 /100 | #296 | Tragic 15.3% |
| Immigrants | Bangladesh | 0.0 /100 | #297 | Tragic 15.3% |
| Immigrants | Senegal | 0.0 /100 | #298 | Tragic 15.3% |
| Senegalese | 0.0 /100 | #299 | Tragic 15.3% |
| Immigrants | Central America | 0.0 /100 | #300 | Tragic 15.4% |
| Bahamians | 0.0 /100 | #301 | Tragic 15.4% |
Demographics Similar to Swiss by Poverty
In terms of poverty, the demographic groups most similar to Swiss are Immigrants from Asia (11.2%, a difference of 0.13%), Immigrants from Netherlands (11.2%, a difference of 0.20%), Austrian (11.2%, a difference of 0.22%), Ukrainian (11.2%, a difference of 0.22%), and Immigrants from Australia (11.2%, a difference of 0.24%).
| Demographics | Rating | Rank | Poverty |
| Scandinavians | 98.2 /100 | #57 | Exceptional 11.1% |
| Germans | 98.1 /100 | #58 | Exceptional 11.1% |
| Immigrants | Europe | 98.0 /100 | #59 | Exceptional 11.2% |
| Immigrants | Sri Lanka | 97.9 /100 | #60 | Exceptional 11.2% |
| Immigrants | Italy | 97.9 /100 | #61 | Exceptional 11.2% |
| Austrians | 97.8 /100 | #62 | Exceptional 11.2% |
| Ukrainians | 97.8 /100 | #63 | Exceptional 11.2% |
| Swiss | 97.7 /100 | #64 | Exceptional 11.2% |
| Immigrants | Asia | 97.5 /100 | #65 | Exceptional 11.2% |
| Immigrants | Netherlands | 97.5 /100 | #66 | Exceptional 11.2% |
| Immigrants | Australia | 97.4 /100 | #67 | Exceptional 11.2% |
| Slovaks | 97.4 /100 | #68 | Exceptional 11.2% |
| Serbians | 97.4 /100 | #69 | Exceptional 11.2% |
| Immigrants | Canada | 97.3 /100 | #70 | Exceptional 11.3% |
| Zimbabweans | 97.3 /100 | #71 | Exceptional 11.3% |