Blackfeet vs Swedish Seniors Poverty Over the Age of 75
COMPARE
Blackfeet
Swedish
Seniors Poverty Over the Age of 75
Seniors Poverty Over the Age of 75 Comparison
Blackfeet
Swedes
13.7%
SENIORS POVERTY OVER THE AGE OF 75
0.2/ 100
METRIC RATING
254th/ 347
METRIC RANK
10.2%
SENIORS POVERTY OVER THE AGE OF 75
100.0/ 100
METRIC RATING
4th/ 347
METRIC RANK
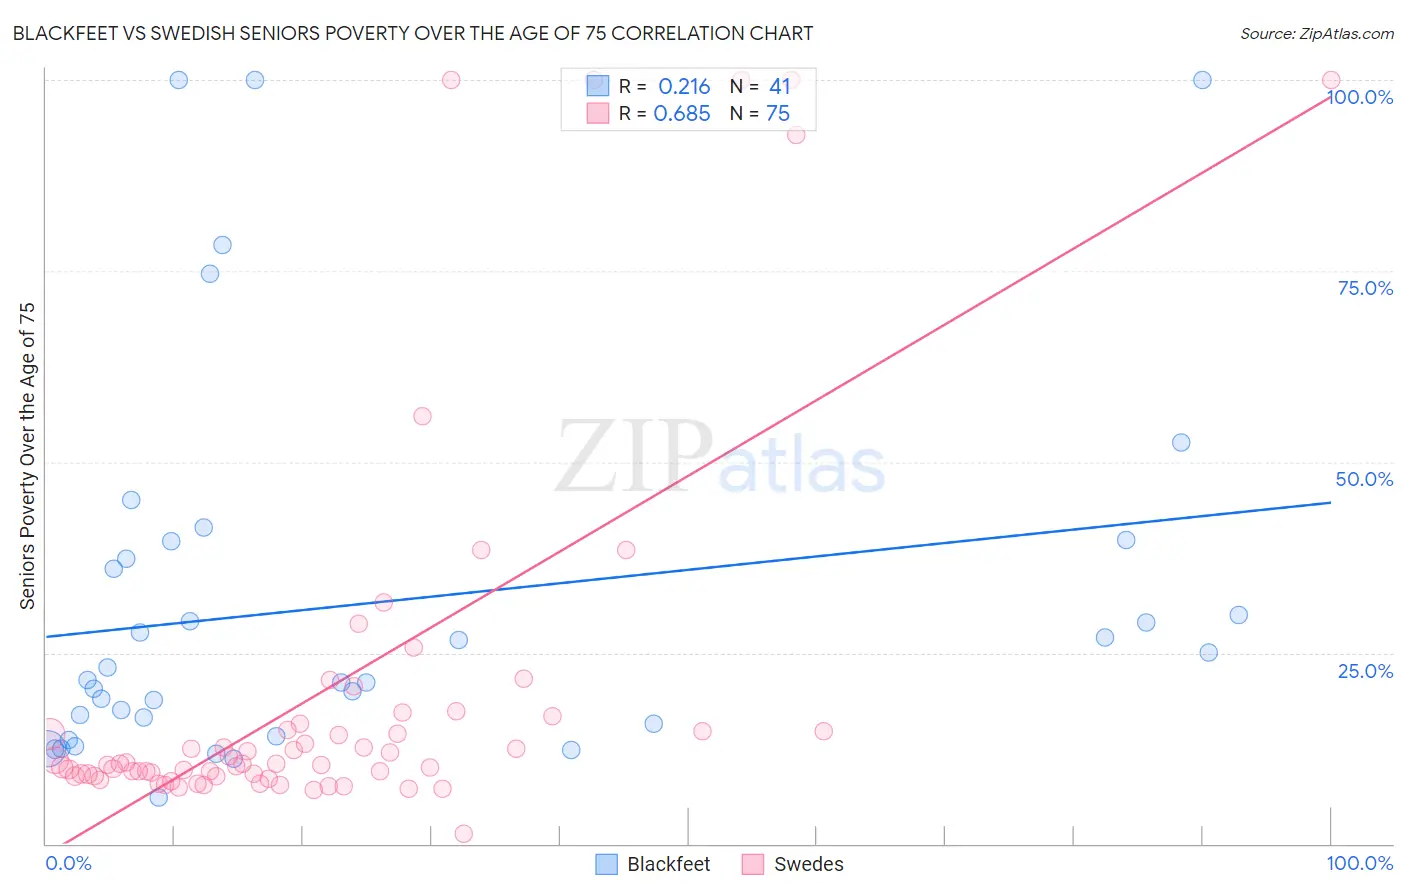
Blackfeet vs Swedish Seniors Poverty Over the Age of 75 Correlation Chart
The statistical analysis conducted on geographies consisting of 307,009,075 people shows a weak positive correlation between the proportion of Blackfeet and poverty level among seniors over the age of 75 in the United States with a correlation coefficient (R) of 0.216 and weighted average of 13.7%. Similarly, the statistical analysis conducted on geographies consisting of 525,274,949 people shows a significant positive correlation between the proportion of Swedes and poverty level among seniors over the age of 75 in the United States with a correlation coefficient (R) of 0.685 and weighted average of 10.2%, a difference of 35.0%.
Seniors Poverty Over the Age of 75 Correlation Summary
| Measurement | Blackfeet | Swedish |
| Minimum | 6.0% | 1.3% |
| Maximum | 100.0% | 100.0% |
| Range | 94.0% | 98.7% |
| Mean | 31.4% | 20.0% |
| Median | 21.5% | 10.4% |
| Interquartile 25% (IQ1) | 14.9% | 8.9% |
| Interquartile 75% (IQ3) | 38.4% | 15.8% |
| Interquartile Range (IQR) | 23.5% | 6.9% |
| Standard Deviation (Sample) | 25.0% | 24.8% |
| Standard Deviation (Population) | 24.6% | 24.6% |
Similar Demographics by Seniors Poverty Over the Age of 75
Demographics Similar to Blackfeet by Seniors Poverty Over the Age of 75
In terms of seniors poverty over the age of 75, the demographic groups most similar to Blackfeet are Immigrants from Spain (13.7%, a difference of 0.11%), Immigrants from Argentina (13.7%, a difference of 0.33%), Immigrants from Peru (13.7%, a difference of 0.38%), Immigrants from Belarus (13.8%, a difference of 0.43%), and Mexican American Indian (13.6%, a difference of 0.71%).
| Demographics | Rating | Rank | Seniors Poverty Over the Age of 75 |
| Immigrants | Ukraine | 0.3 /100 | #247 | Tragic 13.6% |
| Africans | 0.3 /100 | #248 | Tragic 13.6% |
| Immigrants | Albania | 0.3 /100 | #249 | Tragic 13.6% |
| Mexican American Indians | 0.3 /100 | #250 | Tragic 13.6% |
| Immigrants | Peru | 0.3 /100 | #251 | Tragic 13.7% |
| Immigrants | Argentina | 0.3 /100 | #252 | Tragic 13.7% |
| Immigrants | Spain | 0.2 /100 | #253 | Tragic 13.7% |
| Blackfeet | 0.2 /100 | #254 | Tragic 13.7% |
| Immigrants | Belarus | 0.2 /100 | #255 | Tragic 13.8% |
| Inupiat | 0.1 /100 | #256 | Tragic 13.8% |
| Immigrants | Western Africa | 0.1 /100 | #257 | Tragic 13.9% |
| Immigrants | Panama | 0.1 /100 | #258 | Tragic 13.9% |
| Immigrants | Portugal | 0.1 /100 | #259 | Tragic 13.9% |
| Immigrants | Immigrants | 0.1 /100 | #260 | Tragic 13.9% |
| Ghanaians | 0.1 /100 | #261 | Tragic 14.0% |
Demographics Similar to Swedes by Seniors Poverty Over the Age of 75
In terms of seniors poverty over the age of 75, the demographic groups most similar to Swedes are Norwegian (10.2%, a difference of 0.40%), Danish (10.2%, a difference of 0.67%), Native Hawaiian (10.1%, a difference of 0.85%), Maltese (10.3%, a difference of 1.3%), and German (10.4%, a difference of 1.9%).
| Demographics | Rating | Rank | Seniors Poverty Over the Age of 75 |
| Chinese | 100.0 /100 | #1 | Exceptional 9.1% |
| Tlingit-Haida | 100.0 /100 | #2 | Exceptional 9.7% |
| Native Hawaiians | 100.0 /100 | #3 | Exceptional 10.1% |
| Swedes | 100.0 /100 | #4 | Exceptional 10.2% |
| Norwegians | 100.0 /100 | #5 | Exceptional 10.2% |
| Danes | 100.0 /100 | #6 | Exceptional 10.2% |
| Maltese | 100.0 /100 | #7 | Exceptional 10.3% |
| Germans | 99.9 /100 | #8 | Exceptional 10.4% |
| English | 99.9 /100 | #9 | Exceptional 10.4% |
| Scandinavians | 99.9 /100 | #10 | Exceptional 10.4% |
| Immigrants | India | 99.9 /100 | #11 | Exceptional 10.4% |
| Tongans | 99.9 /100 | #12 | Exceptional 10.5% |
| Croatians | 99.9 /100 | #13 | Exceptional 10.5% |
| Scottish | 99.9 /100 | #14 | Exceptional 10.5% |
| Europeans | 99.9 /100 | #15 | Exceptional 10.5% |