Bermudan vs Immigrants from Ecuador Seniors Poverty Over the Age of 65
COMPARE
Bermudan
Immigrants from Ecuador
Seniors Poverty Over the Age of 65
Seniors Poverty Over the Age of 65 Comparison
Bermudans
Immigrants from Ecuador
11.9%
SENIORS POVERTY OVER THE AGE OF 65
2.1/ 100
METRIC RATING
230th/ 347
METRIC RANK
14.4%
SENIORS POVERTY OVER THE AGE OF 65
0.0/ 100
METRIC RATING
315th/ 347
METRIC RANK
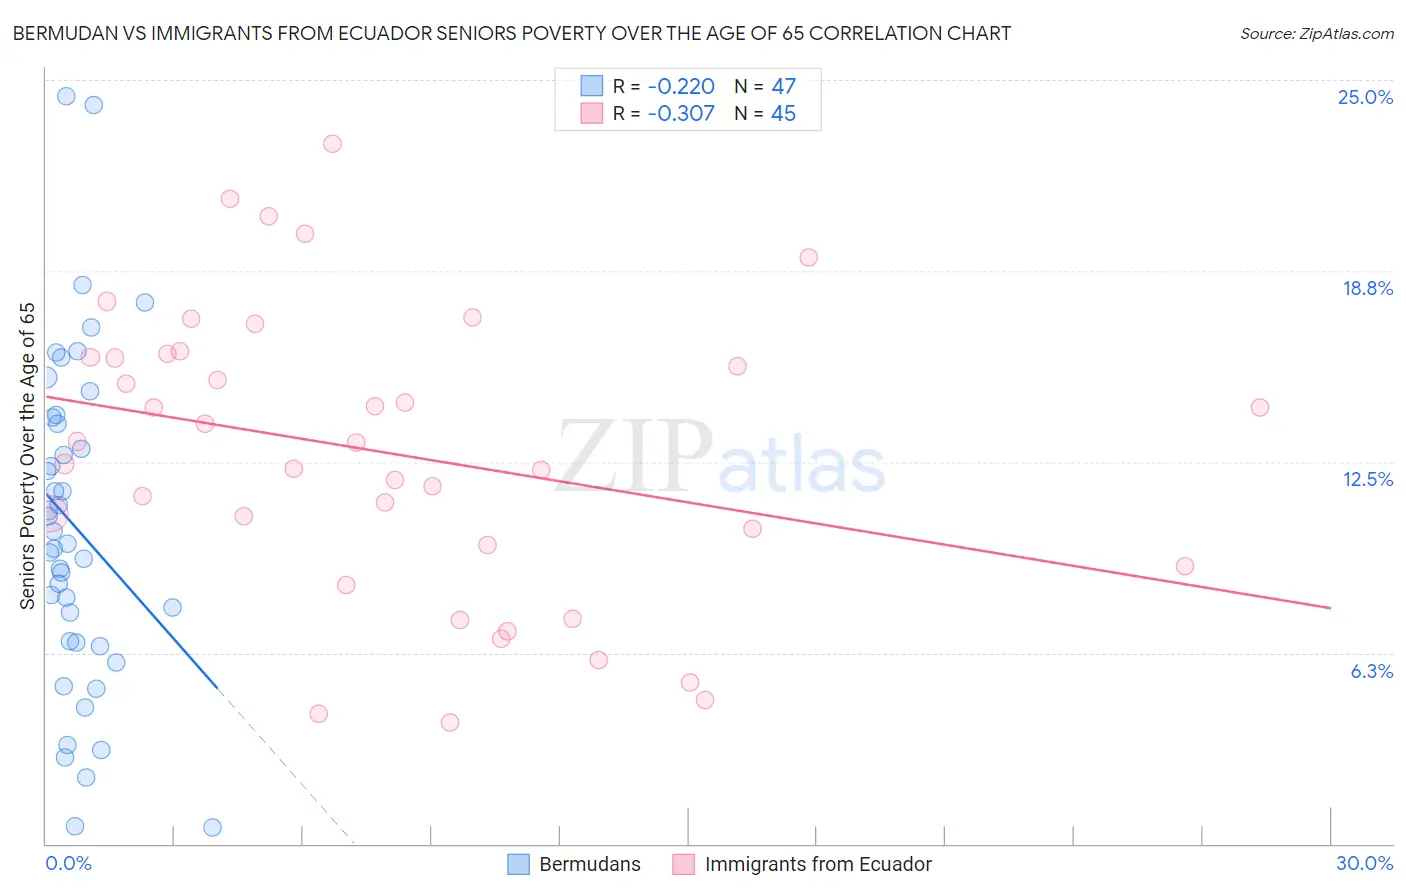
Bermudan vs Immigrants from Ecuador Seniors Poverty Over the Age of 65 Correlation Chart
The statistical analysis conducted on geographies consisting of 55,699,016 people shows a weak negative correlation between the proportion of Bermudans and poverty level among seniors over the age of 65 in the United States with a correlation coefficient (R) of -0.220 and weighted average of 11.9%. Similarly, the statistical analysis conducted on geographies consisting of 270,249,118 people shows a mild negative correlation between the proportion of Immigrants from Ecuador and poverty level among seniors over the age of 65 in the United States with a correlation coefficient (R) of -0.307 and weighted average of 14.4%, a difference of 21.5%.
Seniors Poverty Over the Age of 65 Correlation Summary
| Measurement | Bermudan | Immigrants from Ecuador |
| Minimum | 0.55% | 4.0% |
| Maximum | 24.5% | 22.9% |
| Range | 23.9% | 19.0% |
| Mean | 10.4% | 12.8% |
| Median | 9.8% | 13.1% |
| Interquartile 25% (IQ1) | 6.6% | 9.4% |
| Interquartile 75% (IQ3) | 14.0% | 16.0% |
| Interquartile Range (IQR) | 7.4% | 6.5% |
| Standard Deviation (Sample) | 5.4% | 4.7% |
| Standard Deviation (Population) | 5.4% | 4.7% |
Similar Demographics by Seniors Poverty Over the Age of 65
Demographics Similar to Bermudans by Seniors Poverty Over the Age of 65
In terms of seniors poverty over the age of 65, the demographic groups most similar to Bermudans are Cajun (11.9%, a difference of 0.050%), Yaqui (11.9%, a difference of 0.19%), Panamanian (11.9%, a difference of 0.29%), Iroquois (11.9%, a difference of 0.38%), and Immigrants from Eritrea (11.8%, a difference of 0.50%).
| Demographics | Rating | Rank | Seniors Poverty Over the Age of 65 |
| Immigrants | Congo | 3.8 /100 | #223 | Tragic 11.7% |
| Immigrants | Nigeria | 3.4 /100 | #224 | Tragic 11.7% |
| Immigrants | Belarus | 3.2 /100 | #225 | Tragic 11.8% |
| Liberians | 3.2 /100 | #226 | Tragic 11.8% |
| Nigerians | 3.2 /100 | #227 | Tragic 11.8% |
| Immigrants | Costa Rica | 2.7 /100 | #228 | Tragic 11.8% |
| Immigrants | Eritrea | 2.6 /100 | #229 | Tragic 11.8% |
| Bermudans | 2.1 /100 | #230 | Tragic 11.9% |
| Cajuns | 2.0 /100 | #231 | Tragic 11.9% |
| Yaqui | 1.9 /100 | #232 | Tragic 11.9% |
| Panamanians | 1.8 /100 | #233 | Tragic 11.9% |
| Iroquois | 1.7 /100 | #234 | Tragic 11.9% |
| Immigrants | Argentina | 1.3 /100 | #235 | Tragic 12.0% |
| Immigrants | Peru | 1.3 /100 | #236 | Tragic 12.0% |
| Moroccans | 1.2 /100 | #237 | Tragic 12.0% |
Demographics Similar to Immigrants from Ecuador by Seniors Poverty Over the Age of 65
In terms of seniors poverty over the age of 65, the demographic groups most similar to Immigrants from Ecuador are Guyanese (14.4%, a difference of 0.030%), Immigrants from Guyana (14.5%, a difference of 0.21%), Haitian (14.5%, a difference of 0.24%), Barbadian (14.4%, a difference of 0.43%), and Immigrants from Honduras (14.5%, a difference of 0.45%).
| Demographics | Rating | Rank | Seniors Poverty Over the Age of 65 |
| Trinidadians and Tobagonians | 0.0 /100 | #308 | Tragic 14.2% |
| Hondurans | 0.0 /100 | #309 | Tragic 14.2% |
| Bahamians | 0.0 /100 | #310 | Tragic 14.2% |
| Natives/Alaskans | 0.0 /100 | #311 | Tragic 14.2% |
| Hispanics or Latinos | 0.0 /100 | #312 | Tragic 14.3% |
| Barbadians | 0.0 /100 | #313 | Tragic 14.4% |
| Guyanese | 0.0 /100 | #314 | Tragic 14.4% |
| Immigrants | Ecuador | 0.0 /100 | #315 | Tragic 14.4% |
| Immigrants | Guyana | 0.0 /100 | #316 | Tragic 14.5% |
| Haitians | 0.0 /100 | #317 | Tragic 14.5% |
| Immigrants | Honduras | 0.0 /100 | #318 | Tragic 14.5% |
| Cape Verdeans | 0.0 /100 | #319 | Tragic 14.7% |
| Immigrants | Haiti | 0.0 /100 | #320 | Tragic 14.7% |
| Houma | 0.0 /100 | #321 | Tragic 14.7% |
| Immigrants | Barbados | 0.0 /100 | #322 | Tragic 14.8% |