Barbadian vs Croatian Seniors Poverty Over the Age of 75
COMPARE
Barbadian
Croatian
Seniors Poverty Over the Age of 75
Seniors Poverty Over the Age of 75 Comparison
Barbadians
Croatians
16.0%
SENIORS POVERTY OVER THE AGE OF 75
0.0/ 100
METRIC RATING
313th/ 347
METRIC RANK
10.5%
SENIORS POVERTY OVER THE AGE OF 75
99.9/ 100
METRIC RATING
13th/ 347
METRIC RANK
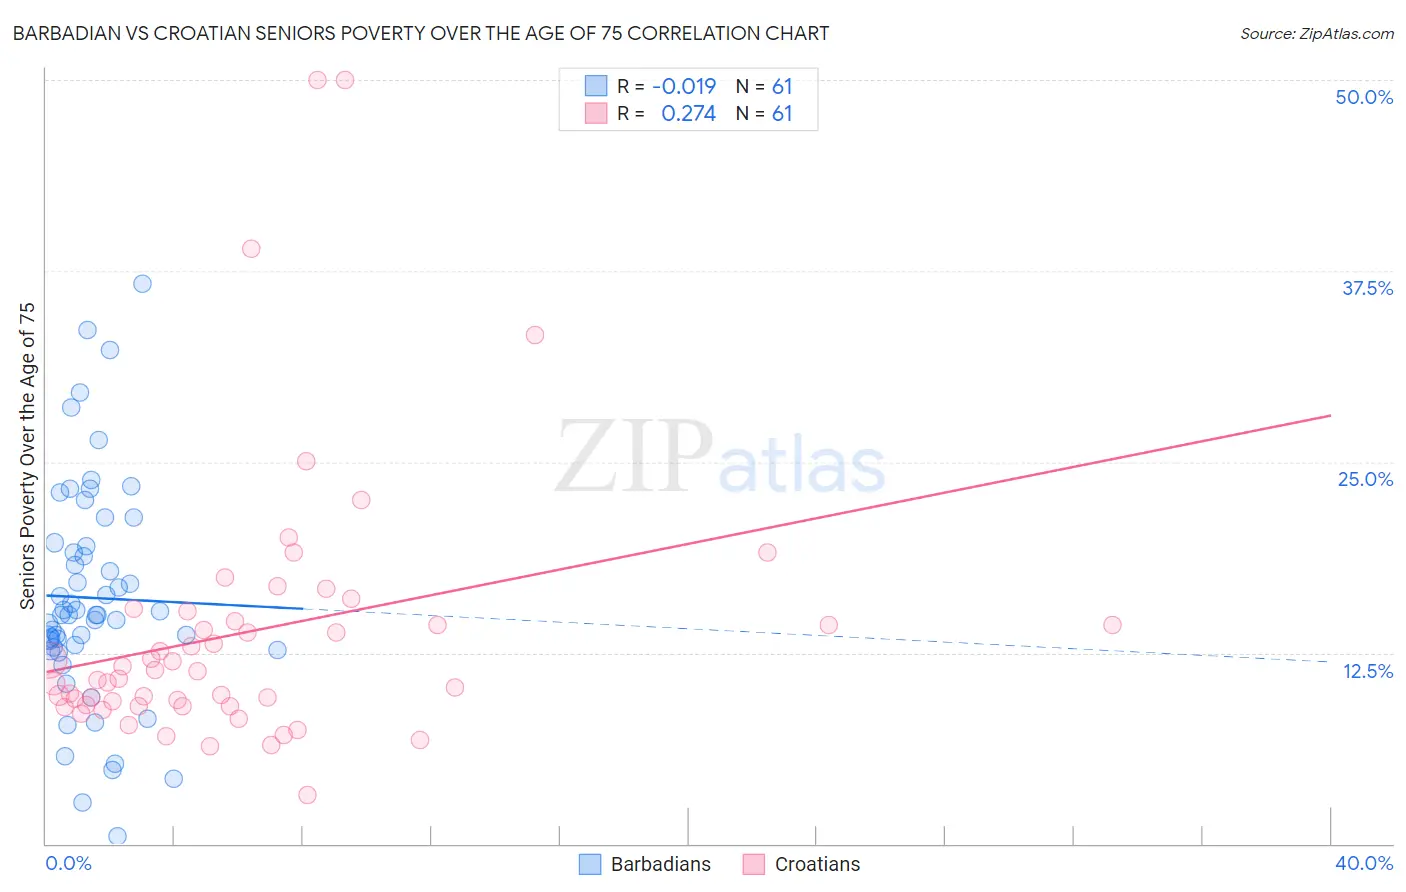
Barbadian vs Croatian Seniors Poverty Over the Age of 75 Correlation Chart
The statistical analysis conducted on geographies consisting of 140,782,961 people shows no correlation between the proportion of Barbadians and poverty level among seniors over the age of 75 in the United States with a correlation coefficient (R) of -0.019 and weighted average of 16.0%. Similarly, the statistical analysis conducted on geographies consisting of 371,524,992 people shows a weak positive correlation between the proportion of Croatians and poverty level among seniors over the age of 75 in the United States with a correlation coefficient (R) of 0.274 and weighted average of 10.5%, a difference of 52.6%.
Seniors Poverty Over the Age of 75 Correlation Summary
| Measurement | Barbadian | Croatian |
| Minimum | 0.48% | 3.2% |
| Maximum | 36.6% | 50.0% |
| Range | 36.1% | 46.8% |
| Mean | 16.1% | 13.9% |
| Median | 15.0% | 11.3% |
| Interquartile 25% (IQ1) | 12.7% | 9.1% |
| Interquartile 75% (IQ3) | 19.6% | 14.9% |
| Interquartile Range (IQR) | 6.8% | 5.8% |
| Standard Deviation (Sample) | 7.3% | 9.0% |
| Standard Deviation (Population) | 7.2% | 8.9% |
Similar Demographics by Seniors Poverty Over the Age of 75
Demographics Similar to Barbadians by Seniors Poverty Over the Age of 75
In terms of seniors poverty over the age of 75, the demographic groups most similar to Barbadians are Tsimshian (16.1%, a difference of 0.35%), Crow (15.9%, a difference of 0.47%), Guyanese (16.1%, a difference of 0.66%), Immigrants from Ecuador (16.1%, a difference of 0.66%), and Trinidadian and Tobagonian (15.9%, a difference of 0.88%).
| Demographics | Rating | Rank | Seniors Poverty Over the Age of 75 |
| Hispanics or Latinos | 0.0 /100 | #306 | Tragic 15.8% |
| Immigrants | West Indies | 0.0 /100 | #307 | Tragic 15.8% |
| Immigrants | Bangladesh | 0.0 /100 | #308 | Tragic 15.8% |
| Yup'ik | 0.0 /100 | #309 | Tragic 15.8% |
| Vietnamese | 0.0 /100 | #310 | Tragic 15.9% |
| Trinidadians and Tobagonians | 0.0 /100 | #311 | Tragic 15.9% |
| Crow | 0.0 /100 | #312 | Tragic 15.9% |
| Barbadians | 0.0 /100 | #313 | Tragic 16.0% |
| Tsimshian | 0.0 /100 | #314 | Tragic 16.1% |
| Guyanese | 0.0 /100 | #315 | Tragic 16.1% |
| Immigrants | Ecuador | 0.0 /100 | #316 | Tragic 16.1% |
| Immigrants | Guyana | 0.0 /100 | #317 | Tragic 16.2% |
| Houma | 0.0 /100 | #318 | Tragic 16.2% |
| Haitians | 0.0 /100 | #319 | Tragic 16.2% |
| Immigrants | Yemen | 0.0 /100 | #320 | Tragic 16.5% |
Demographics Similar to Croatians by Seniors Poverty Over the Age of 75
In terms of seniors poverty over the age of 75, the demographic groups most similar to Croatians are Tongan (10.5%, a difference of 0.10%), Scottish (10.5%, a difference of 0.15%), European (10.5%, a difference of 0.15%), Dutch (10.5%, a difference of 0.27%), and Immigrants from India (10.4%, a difference of 0.46%).
| Demographics | Rating | Rank | Seniors Poverty Over the Age of 75 |
| Danes | 100.0 /100 | #6 | Exceptional 10.2% |
| Maltese | 100.0 /100 | #7 | Exceptional 10.3% |
| Germans | 99.9 /100 | #8 | Exceptional 10.4% |
| English | 99.9 /100 | #9 | Exceptional 10.4% |
| Scandinavians | 99.9 /100 | #10 | Exceptional 10.4% |
| Immigrants | India | 99.9 /100 | #11 | Exceptional 10.4% |
| Tongans | 99.9 /100 | #12 | Exceptional 10.5% |
| Croatians | 99.9 /100 | #13 | Exceptional 10.5% |
| Scottish | 99.9 /100 | #14 | Exceptional 10.5% |
| Europeans | 99.9 /100 | #15 | Exceptional 10.5% |
| Dutch | 99.9 /100 | #16 | Exceptional 10.5% |
| Slovaks | 99.9 /100 | #17 | Exceptional 10.5% |
| Welsh | 99.9 /100 | #18 | Exceptional 10.5% |
| Immigrants | Scotland | 99.9 /100 | #19 | Exceptional 10.5% |
| Czechs | 99.9 /100 | #20 | Exceptional 10.5% |