Argentinean vs Immigrants from Nigeria Child Poverty Among Boys Under 16
COMPARE
Argentinean
Immigrants from Nigeria
Child Poverty Among Boys Under 16
Child Poverty Among Boys Under 16 Comparison
Argentineans
Immigrants from Nigeria
14.9%
CHILD POVERTY AMONG BOYS UNDER 16
96.7/ 100
METRIC RATING
92nd/ 347
METRIC RANK
18.4%
CHILD POVERTY AMONG BOYS UNDER 16
1.2/ 100
METRIC RATING
233rd/ 347
METRIC RANK
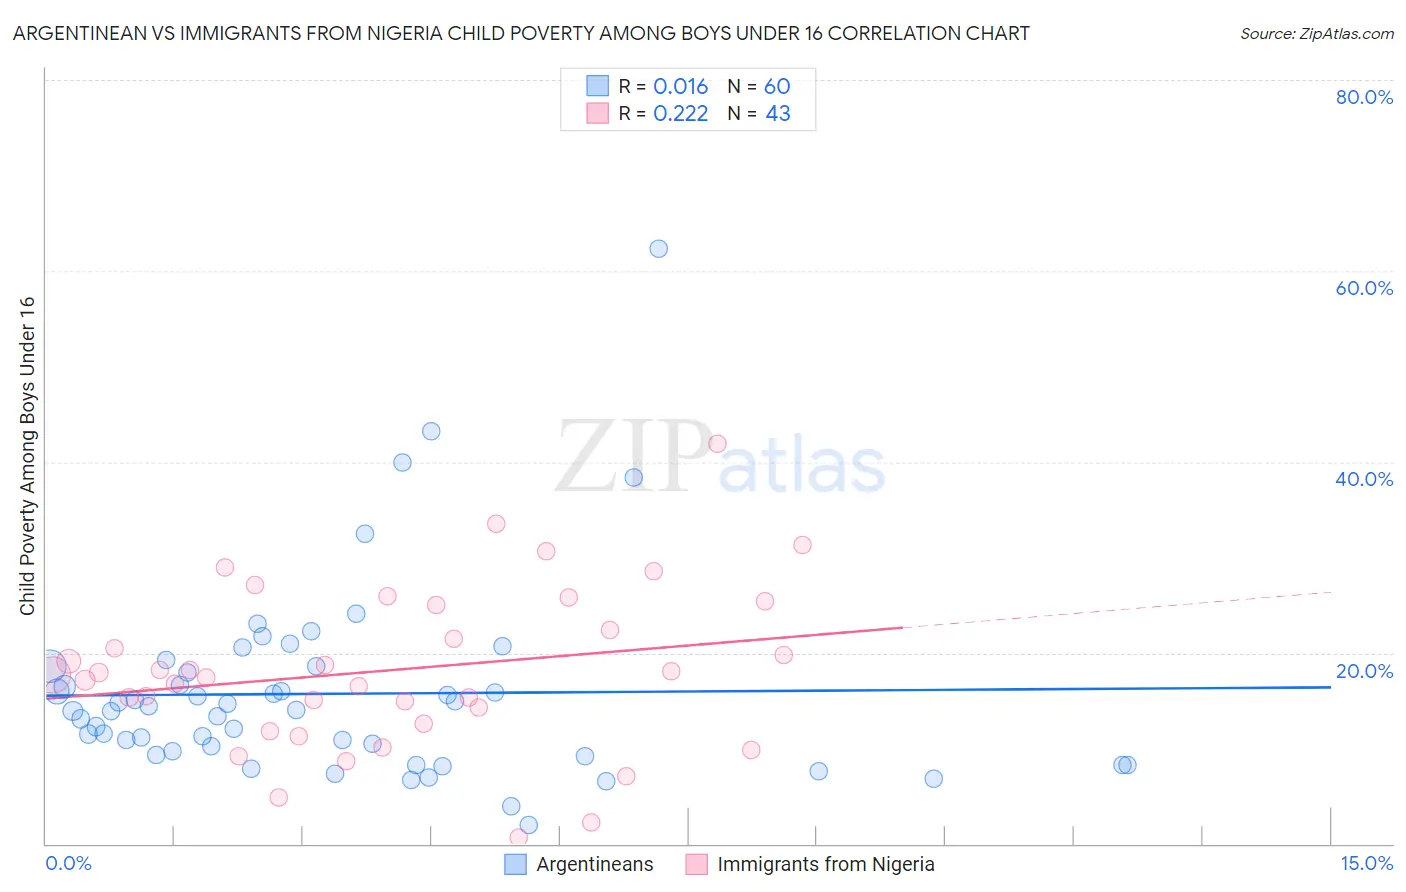
Argentinean vs Immigrants from Nigeria Child Poverty Among Boys Under 16 Correlation Chart
The statistical analysis conducted on geographies consisting of 293,482,177 people shows no correlation between the proportion of Argentineans and poverty level among boys under the age of 16 in the United States with a correlation coefficient (R) of 0.016 and weighted average of 14.9%. Similarly, the statistical analysis conducted on geographies consisting of 281,115,065 people shows a weak positive correlation between the proportion of Immigrants from Nigeria and poverty level among boys under the age of 16 in the United States with a correlation coefficient (R) of 0.222 and weighted average of 18.4%, a difference of 23.9%.
Child Poverty Among Boys Under 16 Correlation Summary
| Measurement | Argentinean | Immigrants from Nigeria |
| Minimum | 2.0% | 0.67% |
| Maximum | 62.4% | 41.9% |
| Range | 60.4% | 41.3% |
| Mean | 15.7% | 18.2% |
| Median | 14.0% | 17.7% |
| Interquartile 25% (IQ1) | 9.5% | 12.6% |
| Interquartile 75% (IQ3) | 18.2% | 25.0% |
| Interquartile Range (IQR) | 8.8% | 12.4% |
| Standard Deviation (Sample) | 10.1% | 8.5% |
| Standard Deviation (Population) | 10.0% | 8.4% |
Similar Demographics by Child Poverty Among Boys Under 16
Demographics Similar to Argentineans by Child Poverty Among Boys Under 16
In terms of child poverty among boys under 16, the demographic groups most similar to Argentineans are Sri Lankan (14.9%, a difference of 0.050%), Immigrants from Italy (14.9%, a difference of 0.050%), Paraguayan (14.9%, a difference of 0.080%), Finnish (14.9%, a difference of 0.16%), and Austrian (14.8%, a difference of 0.37%).
| Demographics | Rating | Rank | Child Poverty Among Boys Under 16 |
| Taiwanese | 97.3 /100 | #85 | Exceptional 14.8% |
| Germans | 97.2 /100 | #86 | Exceptional 14.8% |
| Northern Europeans | 97.2 /100 | #87 | Exceptional 14.8% |
| Immigrants | North America | 97.1 /100 | #88 | Exceptional 14.8% |
| Immigrants | Argentina | 97.1 /100 | #89 | Exceptional 14.8% |
| Austrians | 97.1 /100 | #90 | Exceptional 14.8% |
| Paraguayans | 96.8 /100 | #91 | Exceptional 14.9% |
| Argentineans | 96.7 /100 | #92 | Exceptional 14.9% |
| Sri Lankans | 96.7 /100 | #93 | Exceptional 14.9% |
| Immigrants | Italy | 96.7 /100 | #94 | Exceptional 14.9% |
| Finns | 96.5 /100 | #95 | Exceptional 14.9% |
| Immigrants | North Macedonia | 96.3 /100 | #96 | Exceptional 14.9% |
| Immigrants | Egypt | 96.2 /100 | #97 | Exceptional 14.9% |
| British | 96.2 /100 | #98 | Exceptional 15.0% |
| Immigrants | France | 96.1 /100 | #99 | Exceptional 15.0% |
Demographics Similar to Immigrants from Nigeria by Child Poverty Among Boys Under 16
In terms of child poverty among boys under 16, the demographic groups most similar to Immigrants from Nigeria are Marshallese (18.4%, a difference of 0.19%), Nigerian (18.5%, a difference of 0.25%), Nicaraguan (18.4%, a difference of 0.39%), American (18.6%, a difference of 0.75%), and Sudanese (18.6%, a difference of 0.84%).
| Demographics | Rating | Rank | Child Poverty Among Boys Under 16 |
| Immigrants | Africa | 2.6 /100 | #226 | Tragic 18.1% |
| Bermudans | 2.5 /100 | #227 | Tragic 18.1% |
| Immigrants | Nonimmigrants | 2.2 /100 | #228 | Tragic 18.2% |
| Immigrants | Micronesia | 1.8 /100 | #229 | Tragic 18.3% |
| Fijians | 1.8 /100 | #230 | Tragic 18.3% |
| Nicaraguans | 1.4 /100 | #231 | Tragic 18.4% |
| Marshallese | 1.3 /100 | #232 | Tragic 18.4% |
| Immigrants | Nigeria | 1.2 /100 | #233 | Tragic 18.4% |
| Nigerians | 1.1 /100 | #234 | Tragic 18.5% |
| Americans | 0.9 /100 | #235 | Tragic 18.6% |
| Sudanese | 0.9 /100 | #236 | Tragic 18.6% |
| Immigrants | Eritrea | 0.8 /100 | #237 | Tragic 18.6% |
| Immigrants | Laos | 0.8 /100 | #238 | Tragic 18.7% |
| Cape Verdeans | 0.7 /100 | #239 | Tragic 18.7% |
| Immigrants | Cuba | 0.6 /100 | #240 | Tragic 18.8% |