American vs New Zealander Female Poverty Among 25-34 Year Olds
COMPARE
American
New Zealander
Female Poverty Among 25-34 Year Olds
Female Poverty Among 25-34 Year Olds Comparison
Americans
New Zealanders
16.4%
FEMALE POVERTY AMONG 25-34 YEAR OLDS
0.0/ 100
METRIC RATING
287th/ 347
METRIC RANK
13.1%
FEMALE POVERTY AMONG 25-34 YEAR OLDS
83.4/ 100
METRIC RATING
141st/ 347
METRIC RANK
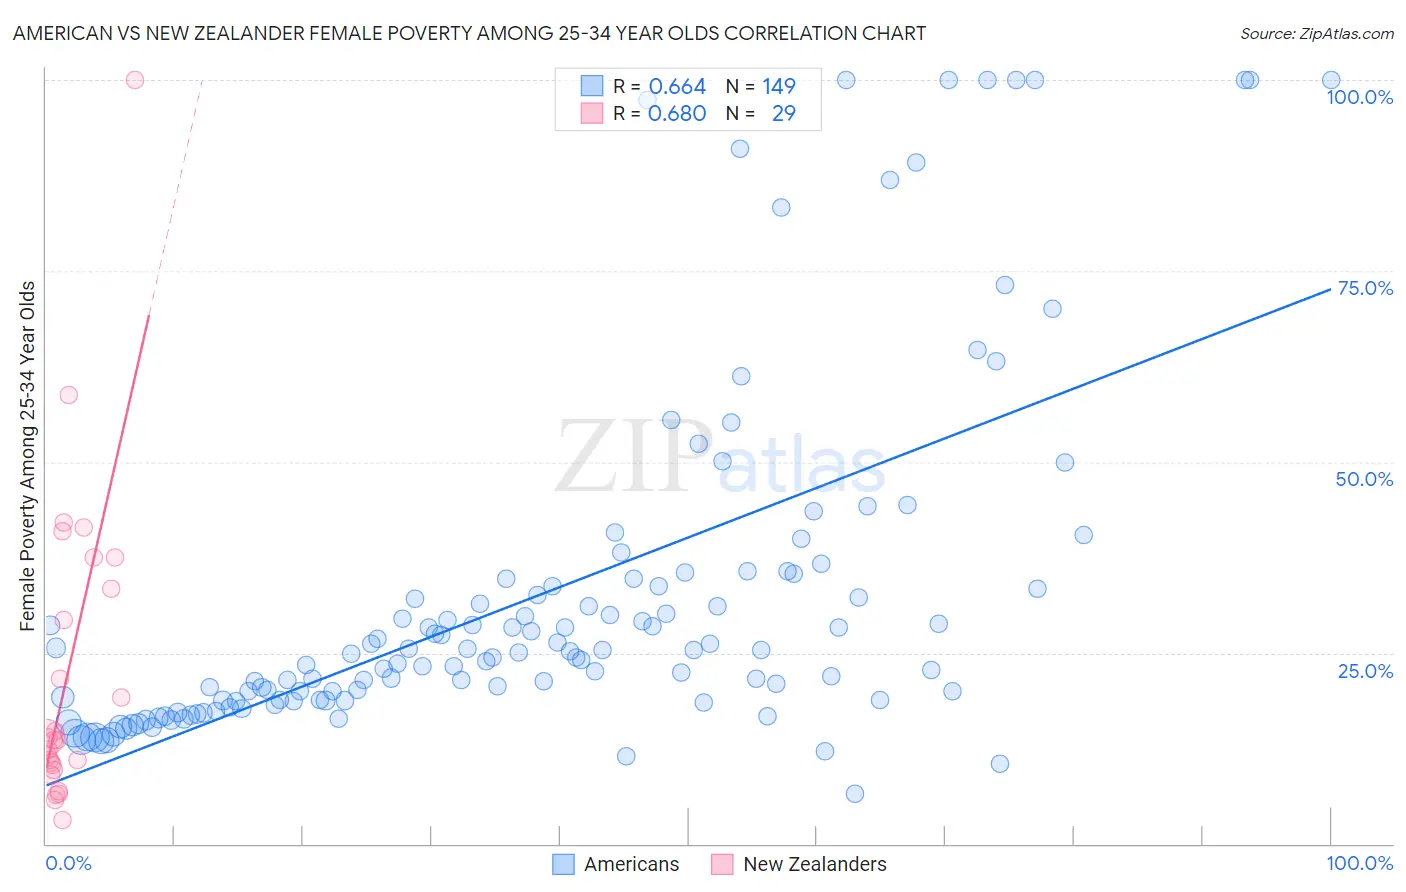
American vs New Zealander Female Poverty Among 25-34 Year Olds Correlation Chart
The statistical analysis conducted on geographies consisting of 557,545,883 people shows a significant positive correlation between the proportion of Americans and poverty level among females between the ages 25 and 34 in the United States with a correlation coefficient (R) of 0.664 and weighted average of 16.4%. Similarly, the statistical analysis conducted on geographies consisting of 106,217,230 people shows a significant positive correlation between the proportion of New Zealanders and poverty level among females between the ages 25 and 34 in the United States with a correlation coefficient (R) of 0.680 and weighted average of 13.1%, a difference of 25.0%.
Female Poverty Among 25-34 Year Olds Correlation Summary
| Measurement | American | New Zealander |
| Minimum | 6.5% | 3.1% |
| Maximum | 100.0% | 100.0% |
| Range | 93.5% | 96.9% |
| Mean | 32.5% | 22.2% |
| Median | 25.0% | 13.6% |
| Interquartile 25% (IQ1) | 18.8% | 10.0% |
| Interquartile 75% (IQ3) | 34.2% | 35.4% |
| Interquartile Range (IQR) | 15.5% | 25.4% |
| Standard Deviation (Sample) | 22.9% | 20.6% |
| Standard Deviation (Population) | 22.8% | 20.3% |
Similar Demographics by Female Poverty Among 25-34 Year Olds
Demographics Similar to Americans by Female Poverty Among 25-34 Year Olds
In terms of female poverty among 25-34 year olds, the demographic groups most similar to Americans are Cape Verdean (16.3%, a difference of 0.050%), Guatemalan (16.4%, a difference of 0.19%), Immigrants from Bahamas (16.3%, a difference of 0.23%), Osage (16.4%, a difference of 0.25%), and Indonesian (16.4%, a difference of 0.40%).
| Demographics | Rating | Rank | Female Poverty Among 25-34 Year Olds |
| Bangladeshis | 0.0 /100 | #280 | Tragic 15.9% |
| Immigrants | Latin America | 0.0 /100 | #281 | Tragic 16.0% |
| Aleuts | 0.0 /100 | #282 | Tragic 16.1% |
| Bahamians | 0.0 /100 | #283 | Tragic 16.1% |
| Shoshone | 0.0 /100 | #284 | Tragic 16.2% |
| Immigrants | Bahamas | 0.0 /100 | #285 | Tragic 16.3% |
| Cape Verdeans | 0.0 /100 | #286 | Tragic 16.3% |
| Americans | 0.0 /100 | #287 | Tragic 16.4% |
| Guatemalans | 0.0 /100 | #288 | Tragic 16.4% |
| Osage | 0.0 /100 | #289 | Tragic 16.4% |
| Indonesians | 0.0 /100 | #290 | Tragic 16.4% |
| Comanche | 0.0 /100 | #291 | Tragic 16.5% |
| Immigrants | Dominica | 0.0 /100 | #292 | Tragic 16.5% |
| Potawatomi | 0.0 /100 | #293 | Tragic 16.5% |
| Immigrants | Central America | 0.0 /100 | #294 | Tragic 16.6% |
Demographics Similar to New Zealanders by Female Poverty Among 25-34 Year Olds
In terms of female poverty among 25-34 year olds, the demographic groups most similar to New Zealanders are Immigrants from Iraq (13.1%, a difference of 0.040%), Austrian (13.1%, a difference of 0.060%), Scandinavian (13.1%, a difference of 0.16%), Brazilian (13.1%, a difference of 0.18%), and Immigrants from Chile (13.1%, a difference of 0.20%).
| Demographics | Rating | Rank | Female Poverty Among 25-34 Year Olds |
| Afghans | 85.8 /100 | #134 | Excellent 13.0% |
| South Africans | 85.7 /100 | #135 | Excellent 13.0% |
| Immigrants | England | 85.5 /100 | #136 | Excellent 13.0% |
| Immigrants | Chile | 84.6 /100 | #137 | Excellent 13.1% |
| Brazilians | 84.5 /100 | #138 | Excellent 13.1% |
| Austrians | 83.7 /100 | #139 | Excellent 13.1% |
| Immigrants | Iraq | 83.6 /100 | #140 | Excellent 13.1% |
| New Zealanders | 83.4 /100 | #141 | Excellent 13.1% |
| Scandinavians | 82.3 /100 | #142 | Excellent 13.1% |
| Israelis | 81.9 /100 | #143 | Excellent 13.1% |
| Native Hawaiians | 78.9 /100 | #144 | Good 13.2% |
| Colombians | 77.2 /100 | #145 | Good 13.2% |
| South Americans | 76.9 /100 | #146 | Good 13.2% |
| Europeans | 76.8 /100 | #147 | Good 13.2% |
| Lebanese | 76.8 /100 | #148 | Good 13.2% |