American vs Alaska Native Female Poverty Among 18-24 Year Olds
COMPARE
American
Alaska Native
Female Poverty Among 18-24 Year Olds
Female Poverty Among 18-24 Year Olds Comparison
Americans
Alaska Natives
21.6%
FEMALE POVERTY AMONG 18-24 YEAR OLDS
0.3/ 100
METRIC RATING
267th/ 347
METRIC RANK
21.5%
FEMALE POVERTY AMONG 18-24 YEAR OLDS
0.3/ 100
METRIC RATING
266th/ 347
METRIC RANK
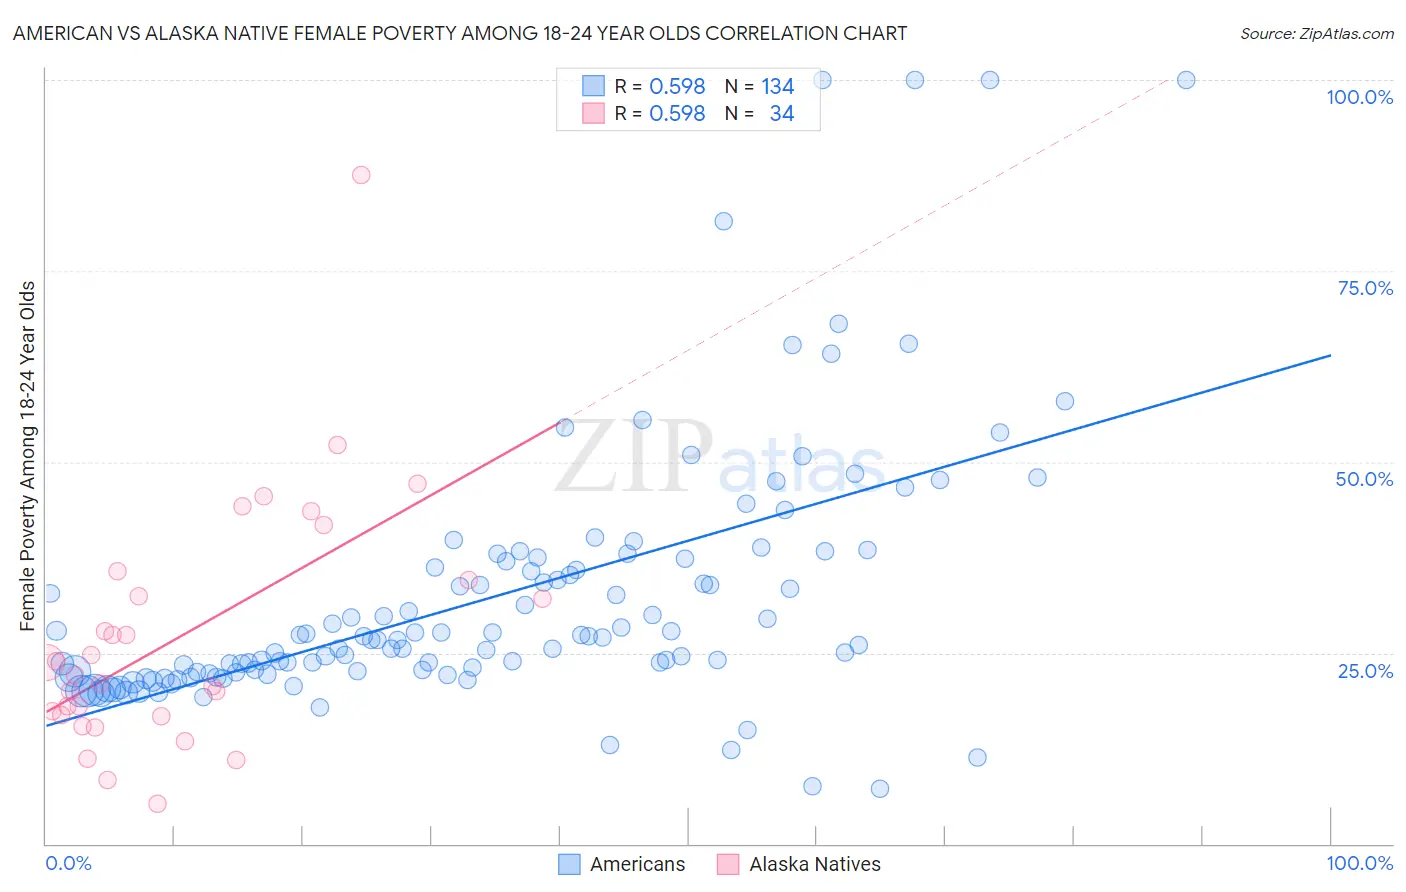
American vs Alaska Native Female Poverty Among 18-24 Year Olds Correlation Chart
The statistical analysis conducted on geographies consisting of 544,575,650 people shows a substantial positive correlation between the proportion of Americans and poverty level among females between the ages 18 and 24 in the United States with a correlation coefficient (R) of 0.598 and weighted average of 21.6%. Similarly, the statistical analysis conducted on geographies consisting of 76,299,380 people shows a substantial positive correlation between the proportion of Alaska Natives and poverty level among females between the ages 18 and 24 in the United States with a correlation coefficient (R) of 0.598 and weighted average of 21.5%, a difference of 0.080%.
Female Poverty Among 18-24 Year Olds Correlation Summary
| Measurement | American | Alaska Native |
| Minimum | 7.1% | 5.2% |
| Maximum | 100.0% | 87.5% |
| Range | 92.9% | 82.3% |
| Mean | 32.2% | 27.1% |
| Median | 26.7% | 22.9% |
| Interquartile 25% (IQ1) | 22.4% | 16.8% |
| Interquartile 75% (IQ3) | 37.0% | 34.6% |
| Interquartile Range (IQR) | 14.6% | 17.8% |
| Standard Deviation (Sample) | 17.1% | 16.0% |
| Standard Deviation (Population) | 17.1% | 15.8% |
Demographics Similar to Americans and Alaska Natives by Female Poverty Among 18-24 Year Olds
In terms of female poverty among 18-24 year olds, the demographic groups most similar to Americans are Nonimmigrants (21.5%, a difference of 0.15%), Immigrants from Burma/Myanmar (21.6%, a difference of 0.15%), Honduran (21.5%, a difference of 0.16%), Icelander (21.5%, a difference of 0.21%), and Celtic (21.6%, a difference of 0.21%). Similarly, the demographic groups most similar to Alaska Natives are Honduran (21.5%, a difference of 0.070%), Nonimmigrants (21.5%, a difference of 0.070%), Icelander (21.5%, a difference of 0.13%), Immigrants from Burma/Myanmar (21.6%, a difference of 0.23%), and Celtic (21.6%, a difference of 0.29%).
| Demographics | Rating | Rank | Female Poverty Among 18-24 Year Olds |
| Tsimshian | 1.0 /100 | #256 | Tragic 21.2% |
| Taiwanese | 1.0 /100 | #257 | Tragic 21.2% |
| Vietnamese | 0.6 /100 | #258 | Tragic 21.4% |
| Immigrants | France | 0.6 /100 | #259 | Tragic 21.4% |
| Immigrants | Norway | 0.6 /100 | #260 | Tragic 21.4% |
| Immigrants | Bahamas | 0.5 /100 | #261 | Tragic 21.4% |
| Immigrants | Eastern Africa | 0.4 /100 | #262 | Tragic 21.4% |
| Icelanders | 0.3 /100 | #263 | Tragic 21.5% |
| Hondurans | 0.3 /100 | #264 | Tragic 21.5% |
| Immigrants | Nonimmigrants | 0.3 /100 | #265 | Tragic 21.5% |
| Alaska Natives | 0.3 /100 | #266 | Tragic 21.5% |
| Americans | 0.3 /100 | #267 | Tragic 21.6% |
| Immigrants | Burma/Myanmar | 0.2 /100 | #268 | Tragic 21.6% |
| Celtics | 0.2 /100 | #269 | Tragic 21.6% |
| Mongolians | 0.2 /100 | #270 | Tragic 21.6% |
| Scotch-Irish | 0.2 /100 | #271 | Tragic 21.6% |
| Basques | 0.2 /100 | #272 | Tragic 21.7% |
| New Zealanders | 0.2 /100 | #273 | Tragic 21.7% |
| Immigrants | Honduras | 0.1 /100 | #274 | Tragic 21.8% |
| Immigrants | Bangladesh | 0.1 /100 | #275 | Tragic 21.8% |
| Bahamians | 0.1 /100 | #276 | Tragic 21.8% |