Alsatian vs Pueblo Child Poverty Under the Age of 5
COMPARE
Alsatian
Pueblo
Child Poverty Under the Age of 5
Child Poverty Under the Age of 5 Comparison
Alsatians
Pueblo
19.1%
CHILD POVERTY UNDER THE AGE OF 5
1.7/ 100
METRIC RATING
222nd/ 347
METRIC RANK
23.7%
CHILD POVERTY UNDER THE AGE OF 5
0.0/ 100
METRIC RATING
323rd/ 347
METRIC RANK
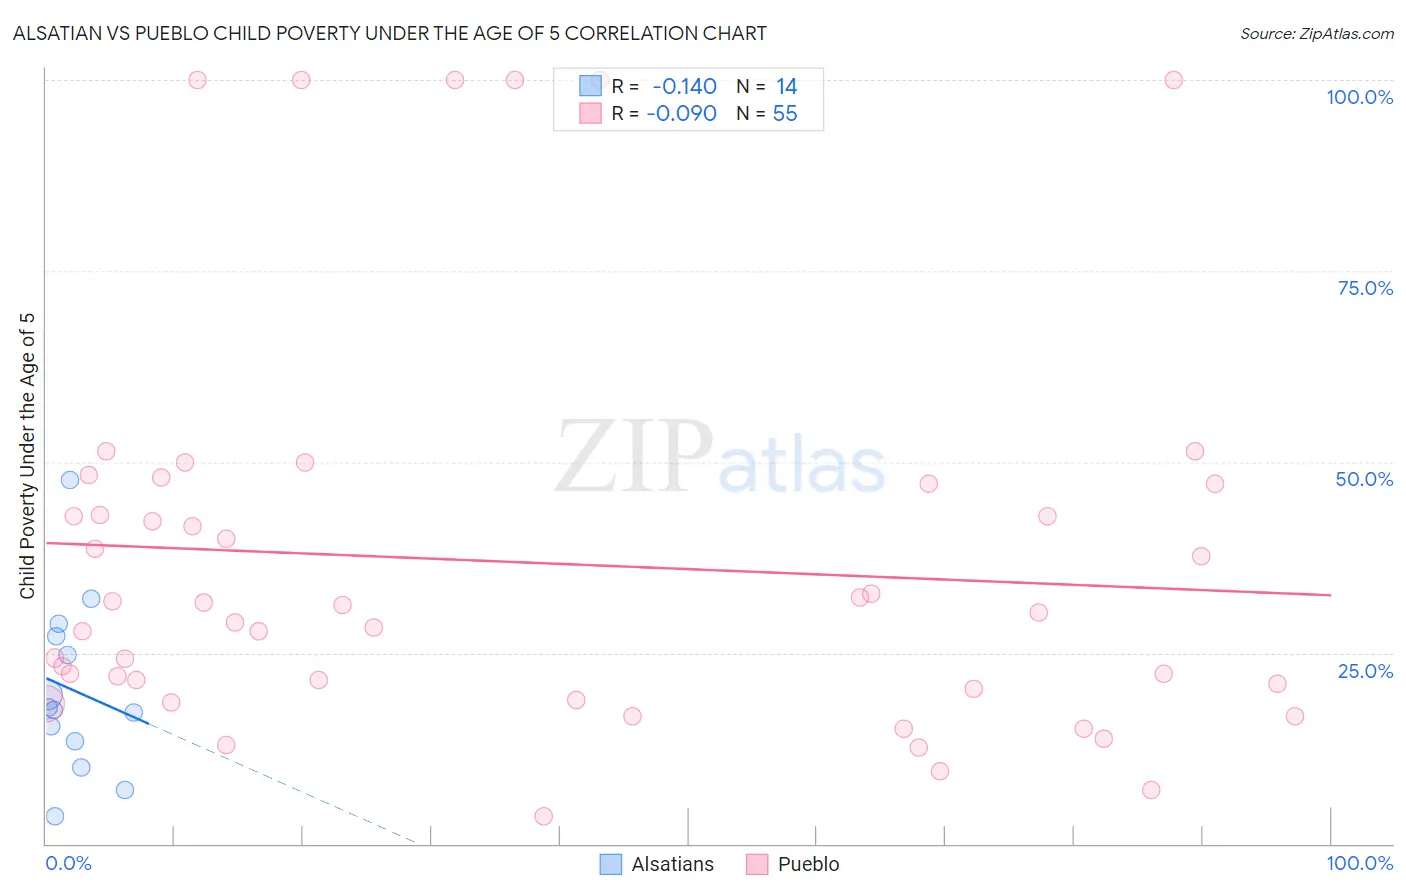
Alsatian vs Pueblo Child Poverty Under the Age of 5 Correlation Chart
The statistical analysis conducted on geographies consisting of 81,245,568 people shows a poor negative correlation between the proportion of Alsatians and poverty level among children under the age of 5 in the United States with a correlation coefficient (R) of -0.140 and weighted average of 19.1%. Similarly, the statistical analysis conducted on geographies consisting of 118,714,547 people shows a slight negative correlation between the proportion of Pueblo and poverty level among children under the age of 5 in the United States with a correlation coefficient (R) of -0.090 and weighted average of 23.7%, a difference of 24.3%.
Child Poverty Under the Age of 5 Correlation Summary
| Measurement | Alsatian | Pueblo |
| Minimum | 3.7% | 3.5% |
| Maximum | 47.6% | 100.0% |
| Range | 43.9% | 96.5% |
| Mean | 20.2% | 36.8% |
| Median | 17.7% | 30.3% |
| Interquartile 25% (IQ1) | 13.4% | 20.4% |
| Interquartile 75% (IQ3) | 27.1% | 47.1% |
| Interquartile Range (IQR) | 13.7% | 26.7% |
| Standard Deviation (Sample) | 11.4% | 25.5% |
| Standard Deviation (Population) | 11.0% | 25.3% |
Similar Demographics by Child Poverty Under the Age of 5
Demographics Similar to Alsatians by Child Poverty Under the Age of 5
In terms of child poverty under the age of 5, the demographic groups most similar to Alsatians are Cuban (19.1%, a difference of 0.020%), Nicaraguan (19.1%, a difference of 0.13%), Nigerian (19.1%, a difference of 0.16%), Immigrants from Eritrea (19.1%, a difference of 0.18%), and Cape Verdean (19.1%, a difference of 0.36%).
| Demographics | Rating | Rank | Child Poverty Under the Age of 5 |
| Immigrants | Panama | 6.0 /100 | #215 | Tragic 18.5% |
| Hmong | 5.0 /100 | #216 | Tragic 18.5% |
| Immigrants | Africa | 4.6 /100 | #217 | Tragic 18.6% |
| Delaware | 3.4 /100 | #218 | Tragic 18.7% |
| German Russians | 3.0 /100 | #219 | Tragic 18.8% |
| Immigrants | Azores | 2.6 /100 | #220 | Tragic 18.9% |
| Immigrants | Nigeria | 2.1 /100 | #221 | Tragic 19.0% |
| Alsatians | 1.7 /100 | #222 | Tragic 19.1% |
| Cubans | 1.7 /100 | #223 | Tragic 19.1% |
| Nicaraguans | 1.6 /100 | #224 | Tragic 19.1% |
| Nigerians | 1.6 /100 | #225 | Tragic 19.1% |
| Immigrants | Eritrea | 1.5 /100 | #226 | Tragic 19.1% |
| Cape Verdeans | 1.4 /100 | #227 | Tragic 19.1% |
| Immigrants | Sudan | 1.3 /100 | #228 | Tragic 19.2% |
| Ghanaians | 1.2 /100 | #229 | Tragic 19.2% |
Demographics Similar to Pueblo by Child Poverty Under the Age of 5
In terms of child poverty under the age of 5, the demographic groups most similar to Pueblo are Ute (23.5%, a difference of 0.58%), Paiute (23.8%, a difference of 0.61%), Immigrants from Honduras (23.5%, a difference of 0.81%), Immigrants from Congo (23.9%, a difference of 0.82%), and Choctaw (23.5%, a difference of 0.84%).
| Demographics | Rating | Rank | Child Poverty Under the Age of 5 |
| Yakama | 0.0 /100 | #316 | Tragic 23.1% |
| Menominee | 0.0 /100 | #317 | Tragic 23.3% |
| Dutch West Indians | 0.0 /100 | #318 | Tragic 23.3% |
| Chippewa | 0.0 /100 | #319 | Tragic 23.4% |
| Choctaw | 0.0 /100 | #320 | Tragic 23.5% |
| Immigrants | Honduras | 0.0 /100 | #321 | Tragic 23.5% |
| Ute | 0.0 /100 | #322 | Tragic 23.5% |
| Pueblo | 0.0 /100 | #323 | Tragic 23.7% |
| Paiute | 0.0 /100 | #324 | Tragic 23.8% |
| Immigrants | Congo | 0.0 /100 | #325 | Tragic 23.9% |
| Central American Indians | 0.0 /100 | #326 | Tragic 23.9% |
| Dominicans | 0.0 /100 | #327 | Tragic 24.0% |
| Immigrants | Dominican Republic | 0.0 /100 | #328 | Tragic 24.1% |
| Cajuns | 0.0 /100 | #329 | Tragic 24.1% |
| Creek | 0.0 /100 | #330 | Tragic 24.2% |