Alsatian vs Brazilian Seniors Poverty Over the Age of 75
COMPARE
Alsatian
Brazilian
Seniors Poverty Over the Age of 75
Seniors Poverty Over the Age of 75 Comparison
Alsatians
Brazilians
12.6%
SENIORS POVERTY OVER THE AGE OF 75
17.7/ 100
METRIC RATING
194th/ 347
METRIC RANK
12.8%
SENIORS POVERTY OVER THE AGE OF 75
6.9/ 100
METRIC RATING
211th/ 347
METRIC RANK
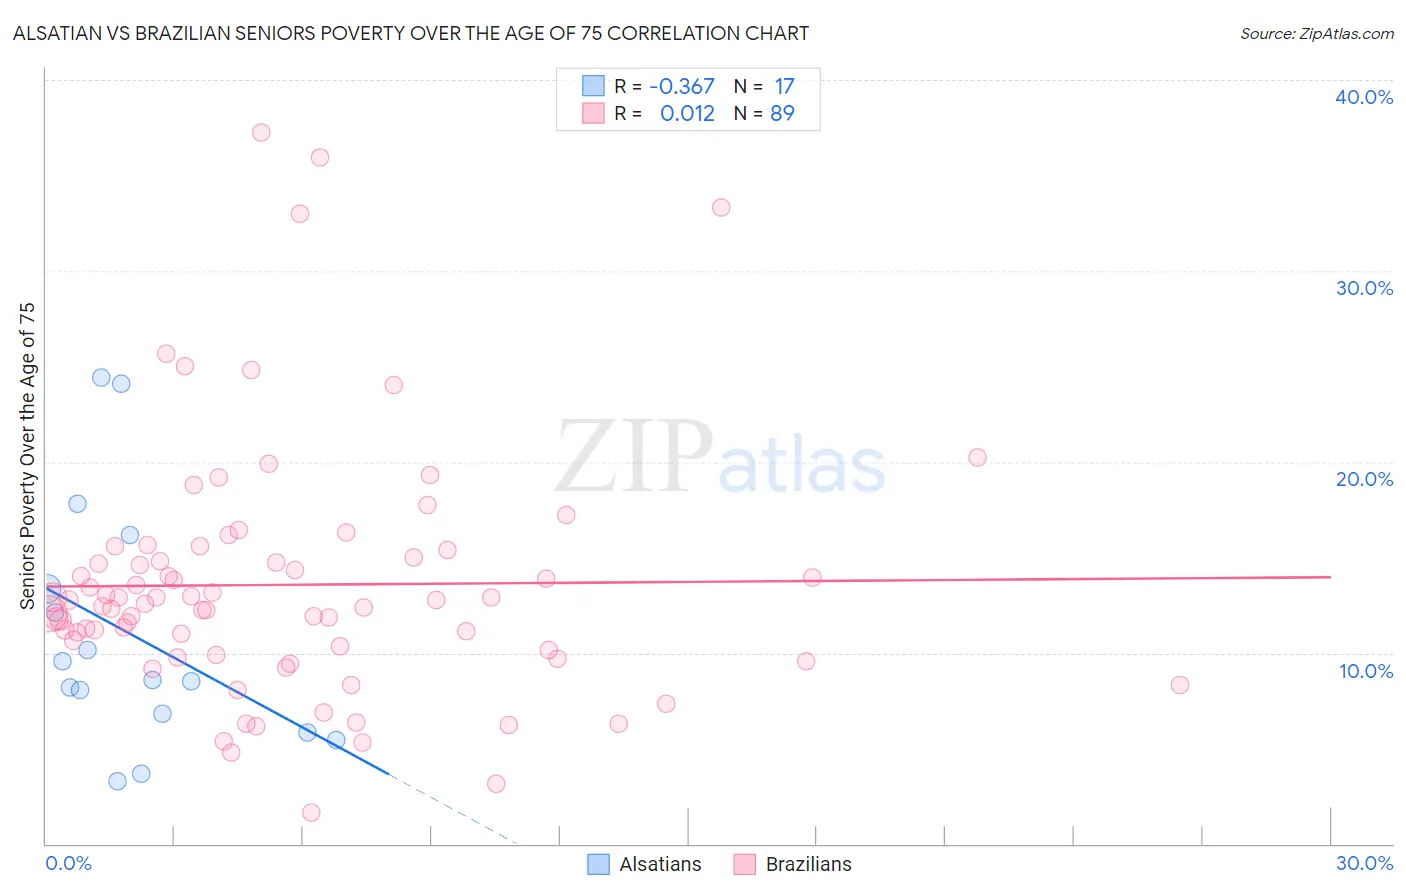
Alsatian vs Brazilian Seniors Poverty Over the Age of 75 Correlation Chart
The statistical analysis conducted on geographies consisting of 82,530,735 people shows a mild negative correlation between the proportion of Alsatians and poverty level among seniors over the age of 75 in the United States with a correlation coefficient (R) of -0.367 and weighted average of 12.6%. Similarly, the statistical analysis conducted on geographies consisting of 320,894,327 people shows no correlation between the proportion of Brazilians and poverty level among seniors over the age of 75 in the United States with a correlation coefficient (R) of 0.012 and weighted average of 12.8%, a difference of 2.1%.
Seniors Poverty Over the Age of 75 Correlation Summary
| Measurement | Alsatian | Brazilian |
| Minimum | 3.3% | 1.6% |
| Maximum | 24.4% | 37.3% |
| Range | 21.2% | 35.6% |
| Mean | 10.9% | 13.6% |
| Median | 8.6% | 12.6% |
| Interquartile 25% (IQ1) | 6.3% | 10.0% |
| Interquartile 75% (IQ3) | 14.8% | 15.2% |
| Interquartile Range (IQR) | 8.4% | 5.2% |
| Standard Deviation (Sample) | 6.4% | 6.5% |
| Standard Deviation (Population) | 6.2% | 6.5% |
Demographics Similar to Alsatians and Brazilians by Seniors Poverty Over the Age of 75
In terms of seniors poverty over the age of 75, the demographic groups most similar to Alsatians are Taiwanese (12.6%, a difference of 0.010%), Immigrants from France (12.6%, a difference of 0.050%), Immigrants from Eastern Europe (12.6%, a difference of 0.23%), Choctaw (12.5%, a difference of 0.32%), and Nepalese (12.6%, a difference of 0.49%). Similarly, the demographic groups most similar to Brazilians are Comanche (12.8%, a difference of 0.020%), Immigrants from Liberia (12.8%, a difference of 0.12%), Immigrants from Hong Kong (12.8%, a difference of 0.13%), Immigrants from Eastern Asia (12.8%, a difference of 0.40%), and Costa Rican (12.8%, a difference of 0.48%).
| Demographics | Rating | Rank | Seniors Poverty Over the Age of 75 |
| Choctaw | 20.2 /100 | #192 | Fair 12.5% |
| Taiwanese | 17.8 /100 | #193 | Poor 12.6% |
| Alsatians | 17.7 /100 | #194 | Poor 12.6% |
| Immigrants | France | 17.4 /100 | #195 | Poor 12.6% |
| Immigrants | Eastern Europe | 16.0 /100 | #196 | Poor 12.6% |
| Nepalese | 14.4 /100 | #197 | Poor 12.6% |
| Chileans | 13.7 /100 | #198 | Poor 12.6% |
| Immigrants | Lebanon | 12.7 /100 | #199 | Poor 12.7% |
| Immigrants | Vietnam | 12.1 /100 | #200 | Poor 12.7% |
| Paraguayans | 11.1 /100 | #201 | Poor 12.7% |
| Arapaho | 10.9 /100 | #202 | Poor 12.7% |
| Immigrants | Southern Europe | 10.7 /100 | #203 | Poor 12.7% |
| Immigrants | Eritrea | 10.5 /100 | #204 | Poor 12.7% |
| Indians (Asian) | 9.7 /100 | #205 | Tragic 12.7% |
| Albanians | 9.6 /100 | #206 | Tragic 12.7% |
| Costa Ricans | 8.7 /100 | #207 | Tragic 12.8% |
| Immigrants | Eastern Asia | 8.4 /100 | #208 | Tragic 12.8% |
| Immigrants | Liberia | 7.3 /100 | #209 | Tragic 12.8% |
| Comanche | 7.0 /100 | #210 | Tragic 12.8% |
| Brazilians | 6.9 /100 | #211 | Tragic 12.8% |
| Immigrants | Hong Kong | 6.5 /100 | #212 | Tragic 12.8% |