Alaska Native vs Peruvian Seniors Poverty Over the Age of 75
COMPARE
Alaska Native
Peruvian
Seniors Poverty Over the Age of 75
Seniors Poverty Over the Age of 75 Comparison
Alaska Natives
Peruvians
11.4%
SENIORS POVERTY OVER THE AGE OF 75
95.4/ 100
METRIC RATING
80th/ 347
METRIC RANK
13.4%
SENIORS POVERTY OVER THE AGE OF 75
0.8/ 100
METRIC RATING
238th/ 347
METRIC RANK
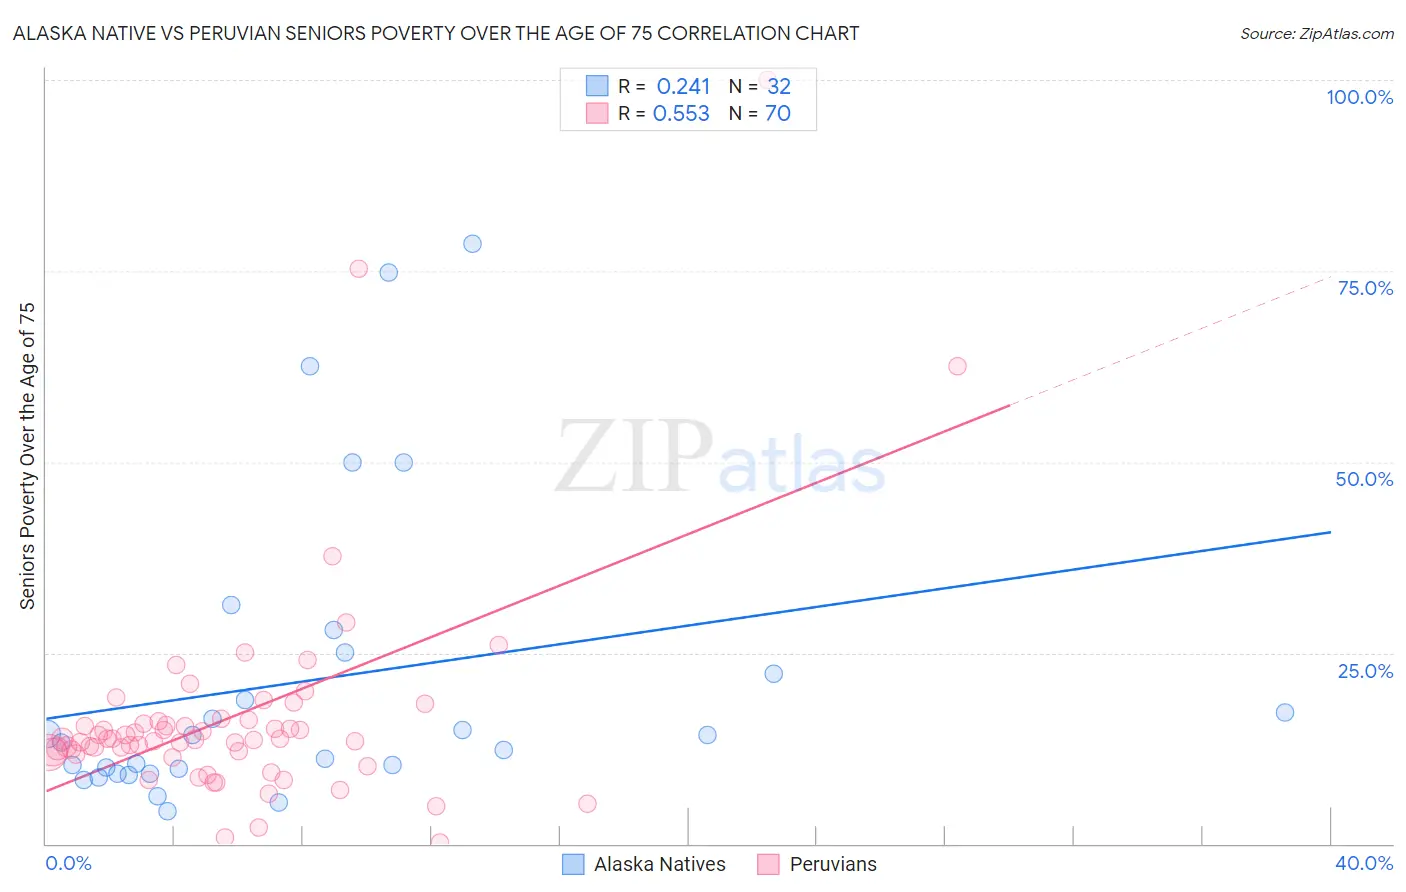
Alaska Native vs Peruvian Seniors Poverty Over the Age of 75 Correlation Chart
The statistical analysis conducted on geographies consisting of 76,287,107 people shows a weak positive correlation between the proportion of Alaska Natives and poverty level among seniors over the age of 75 in the United States with a correlation coefficient (R) of 0.241 and weighted average of 11.4%. Similarly, the statistical analysis conducted on geographies consisting of 359,440,358 people shows a substantial positive correlation between the proportion of Peruvians and poverty level among seniors over the age of 75 in the United States with a correlation coefficient (R) of 0.553 and weighted average of 13.4%, a difference of 16.9%.
Seniors Poverty Over the Age of 75 Correlation Summary
| Measurement | Alaska Native | Peruvian |
| Minimum | 4.3% | 0.17% |
| Maximum | 78.6% | 100.0% |
| Range | 74.2% | 99.8% |
| Mean | 21.3% | 16.7% |
| Median | 13.8% | 13.7% |
| Interquartile 25% (IQ1) | 9.6% | 11.9% |
| Interquartile 75% (IQ3) | 23.6% | 16.0% |
| Interquartile Range (IQR) | 14.1% | 4.1% |
| Standard Deviation (Sample) | 19.9% | 15.0% |
| Standard Deviation (Population) | 19.6% | 14.9% |
Similar Demographics by Seniors Poverty Over the Age of 75
Demographics Similar to Alaska Natives by Seniors Poverty Over the Age of 75
In terms of seniors poverty over the age of 75, the demographic groups most similar to Alaska Natives are Macedonian (11.4%, a difference of 0.060%), Filipino (11.4%, a difference of 0.060%), White/Caucasian (11.4%, a difference of 0.070%), Basque (11.5%, a difference of 0.12%), and Iranian (11.5%, a difference of 0.13%).
| Demographics | Rating | Rank | Seniors Poverty Over the Age of 75 |
| Immigrants | Micronesia | 96.0 /100 | #73 | Exceptional 11.4% |
| Delaware | 96.0 /100 | #74 | Exceptional 11.4% |
| Palestinians | 95.8 /100 | #75 | Exceptional 11.4% |
| French Canadians | 95.7 /100 | #76 | Exceptional 11.4% |
| Whites/Caucasians | 95.5 /100 | #77 | Exceptional 11.4% |
| Macedonians | 95.5 /100 | #78 | Exceptional 11.4% |
| Filipinos | 95.5 /100 | #79 | Exceptional 11.4% |
| Alaska Natives | 95.4 /100 | #80 | Exceptional 11.4% |
| Basques | 95.1 /100 | #81 | Exceptional 11.5% |
| Iranians | 95.1 /100 | #82 | Exceptional 11.5% |
| Immigrants | South Africa | 94.9 /100 | #83 | Exceptional 11.5% |
| Immigrants | Iraq | 94.9 /100 | #84 | Exceptional 11.5% |
| Immigrants | Bulgaria | 94.7 /100 | #85 | Exceptional 11.5% |
| Australians | 94.6 /100 | #86 | Exceptional 11.5% |
| Koreans | 94.5 /100 | #87 | Exceptional 11.5% |
Demographics Similar to Peruvians by Seniors Poverty Over the Age of 75
In terms of seniors poverty over the age of 75, the demographic groups most similar to Peruvians are Alaskan Athabascan (13.4%, a difference of 0.020%), Panamanian (13.4%, a difference of 0.10%), Moroccan (13.3%, a difference of 0.20%), Japanese (13.3%, a difference of 0.21%), and Argentinean (13.4%, a difference of 0.41%).
| Demographics | Rating | Rank | Seniors Poverty Over the Age of 75 |
| Sub-Saharan Africans | 1.5 /100 | #231 | Tragic 13.2% |
| Immigrants | Chile | 1.3 /100 | #232 | Tragic 13.3% |
| Immigrants | Costa Rica | 1.3 /100 | #233 | Tragic 13.3% |
| Immigrants | Israel | 1.1 /100 | #234 | Tragic 13.3% |
| Japanese | 0.9 /100 | #235 | Tragic 13.3% |
| Moroccans | 0.9 /100 | #236 | Tragic 13.3% |
| Alaskan Athabascans | 0.8 /100 | #237 | Tragic 13.4% |
| Peruvians | 0.8 /100 | #238 | Tragic 13.4% |
| Panamanians | 0.8 /100 | #239 | Tragic 13.4% |
| Argentineans | 0.7 /100 | #240 | Tragic 13.4% |
| Immigrants | Russia | 0.6 /100 | #241 | Tragic 13.4% |
| Immigrants | Somalia | 0.6 /100 | #242 | Tragic 13.5% |
| Dutch West Indians | 0.6 /100 | #243 | Tragic 13.5% |
| Spanish Americans | 0.5 /100 | #244 | Tragic 13.5% |
| Uruguayans | 0.5 /100 | #245 | Tragic 13.5% |