Zip Codes with the Highest Percentage of Population with a Degree in Visual and Performing Arts in Hillsboro, OR
RELATED REPORTS & OPTIONS
Visual and Performing Arts
Hillsboro
Compare Zip Codes
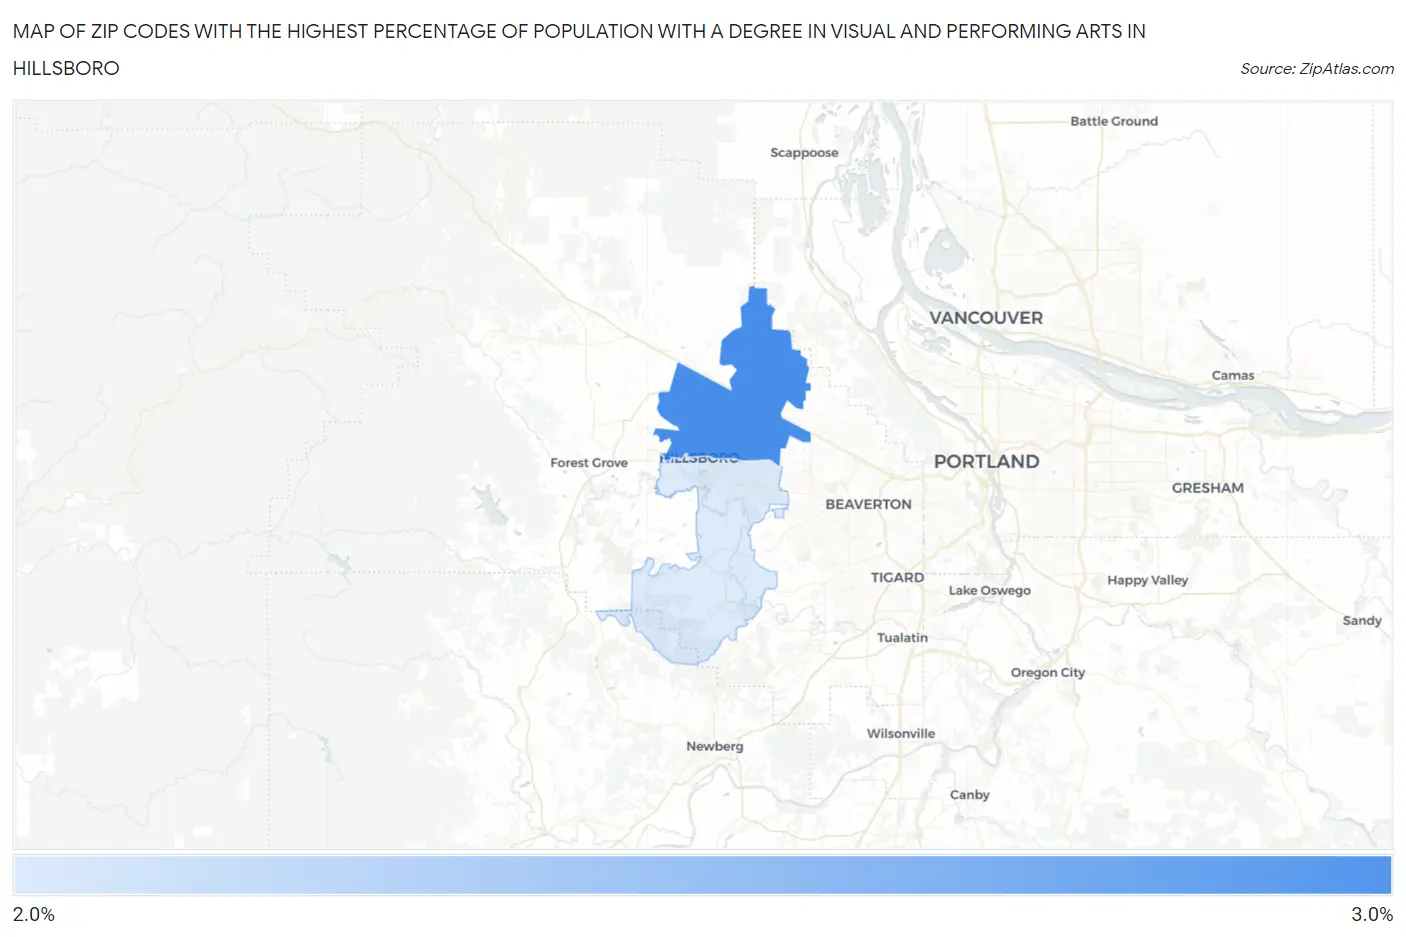
Map of Zip Codes with the Highest Percentage of Population with a Degree in Visual and Performing Arts in Hillsboro
2.7%
2.7%
Zip Codes with the Highest Percentage of Population with a Degree in Visual and Performing Arts in Hillsboro, OR
| Zip Code | % Graduates | vs State | vs National | |
| 1. | 97124 | 2.7% | 5.7%(-2.95)#221 | 4.3%(-1.53)#13,801 |
| 2. | 97123 | 2.7% | 5.7%(-2.96)#222 | 4.3%(-1.54)#13,835 |
1
Common Questions
What are the Top Zip Codes with the Highest Percentage of Population with a Degree in Visual and Performing Arts in Hillsboro, OR?
Top Zip Codes with the Highest Percentage of Population with a Degree in Visual and Performing Arts in Hillsboro, OR are:
What zip code has the Highest Percentage of Population with a Degree in Visual and Performing Arts in Hillsboro, OR?
97124 has the Highest Percentage of Population with a Degree in Visual and Performing Arts in Hillsboro, OR with 2.7%.
What is the Percentage of Population with a Degree in Visual and Performing Arts in Hillsboro, OR?
Percentage of Population with a Degree in Visual and Performing Arts in Hillsboro is 2.9%.
What is the Percentage of Population with a Degree in Visual and Performing Arts in Oregon?
Percentage of Population with a Degree in Visual and Performing Arts in Oregon is 5.7%.
What is the Percentage of Population with a Degree in Visual and Performing Arts in the United States?
Percentage of Population with a Degree in Visual and Performing Arts in the United States is 4.3%.