Zip Codes with the Highest Percentage of Population Driving Alone to Work in Trenton, NJ
RELATED REPORTS & OPTIONS
Drive | Alone
Trenton
Compare Zip Codes
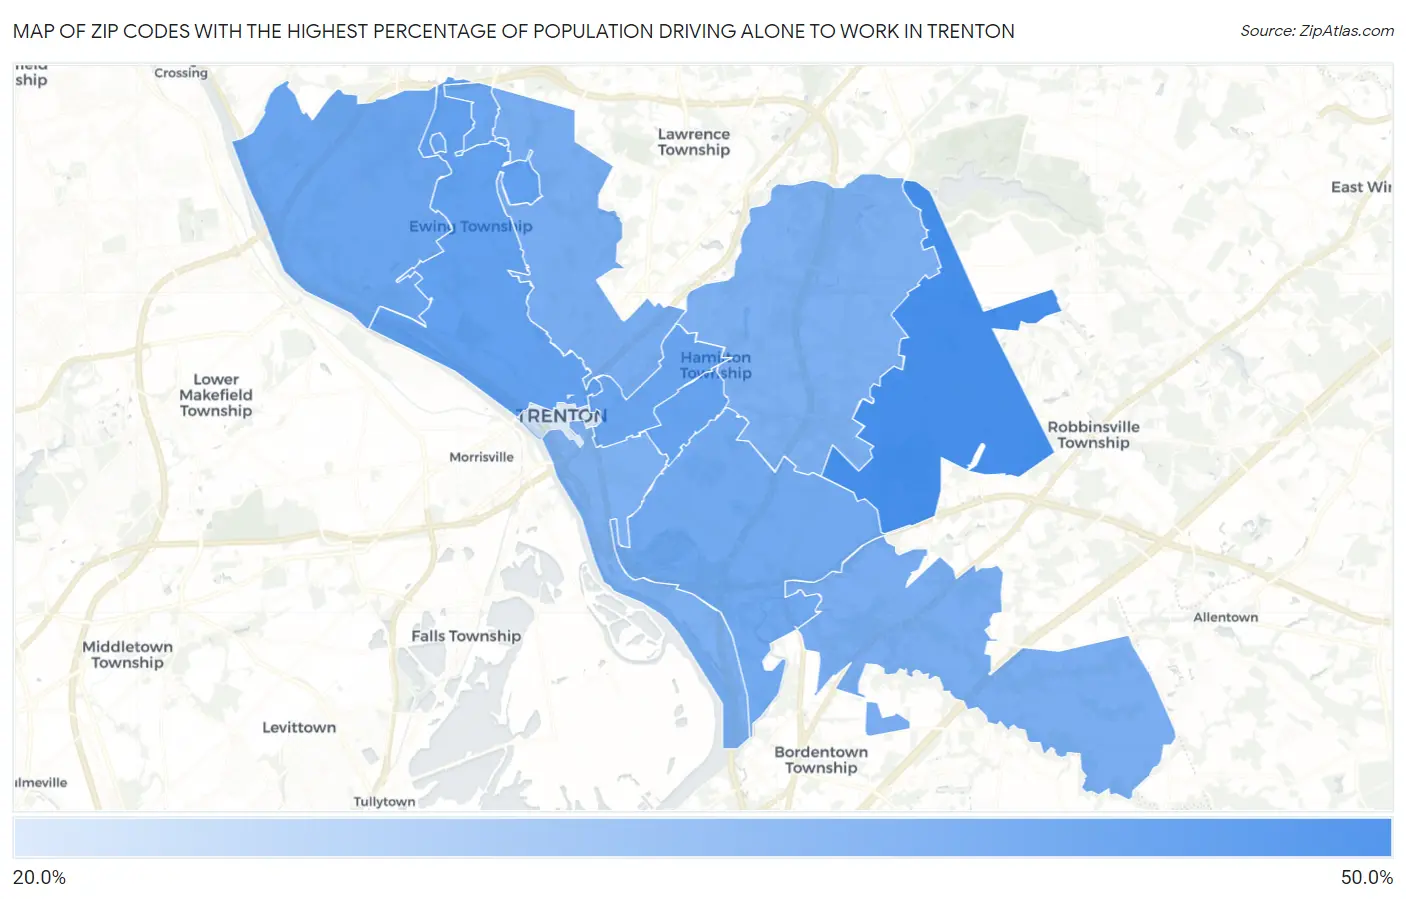
Map of Zip Codes with the Highest Percentage of Population Driving Alone to Work in Trenton
28.1%
48.8%
Zip Codes with the Highest Percentage of Population Driving Alone to Work in Trenton, NJ
| Zip Code | % Drive Alone | vs State | vs National | |
| 1. | 08690 | 48.8% | 44.8%(+4.00)#131 | 42.1%(+6.70)#5,915 |
| 2. | 08618 | 44.8% | 44.8%(=0.000)#324 | 42.1%(+2.70)#13,282 |
| 3. | 08629 | 44.3% | 44.8%(-0.500)#352 | 42.1%(+2.20)#14,541 |
| 4. | 08609 | 43.6% | 44.8%(-1.20)#385 | 42.1%(+1.50)#16,337 |
| 5. | 08628 | 43.3% | 44.8%(-1.50)#400 | 42.1%(+1.20)#17,177 |
| 6. | 08610 | 42.5% | 44.8%(-2.30)#438 | 42.1%(+0.400)#19,180 |
| 7. | 08638 | 41.7% | 44.8%(-3.10)#475 | 42.1%(-0.400)#21,289 |
| 8. | 08620 | 41.5% | 44.8%(-3.30)#490 | 42.1%(-0.600)#21,801 |
| 9. | 08619 | 41.0% | 44.8%(-3.80)#504 | 42.1%(-1.10)#22,917 |
| 10. | 08611 | 40.8% | 44.8%(-4.00)#509 | 42.1%(-1.30)#23,334 |
| 11. | 08608 | 28.1% | 44.8%(-16.7)#571 | 42.1%(-14.0)#30,897 |
1
Common Questions
What are the Top 10 Zip Codes with the Highest Percentage of Population Driving Alone to Work in Trenton, NJ?
Top 10 Zip Codes with the Highest Percentage of Population Driving Alone to Work in Trenton, NJ are:
What zip code has the Highest Percentage of Population Driving Alone to Work in Trenton, NJ?
08690 has the Highest Percentage of Population Driving Alone to Work in Trenton, NJ with 48.8%.
What is the Percentage of Population Driving Alone to Work in Trenton, NJ?
Percentage of Population Driving Alone to Work in Trenton is 43.0%.
What is the Percentage of Population Driving Alone to Work in New Jersey?
Percentage of Population Driving Alone to Work in New Jersey is 44.8%.
What is the Percentage of Population Driving Alone to Work in the United States?
Percentage of Population Driving Alone to Work in the United States is 42.1%.