Venezuelan vs Central American In Labor Force | Age 16-19
COMPARE
Venezuelan
Central American
In Labor Force | Age 16-19
In Labor Force | Age 16-19 Comparison
Venezuelans
Central Americans
34.0%
IN LABOR FORCE | AGE 16-19
0.3/ 100
METRIC RATING
274th/ 347
METRIC RANK
34.8%
IN LABOR FORCE | AGE 16-19
2.2/ 100
METRIC RATING
248th/ 347
METRIC RANK
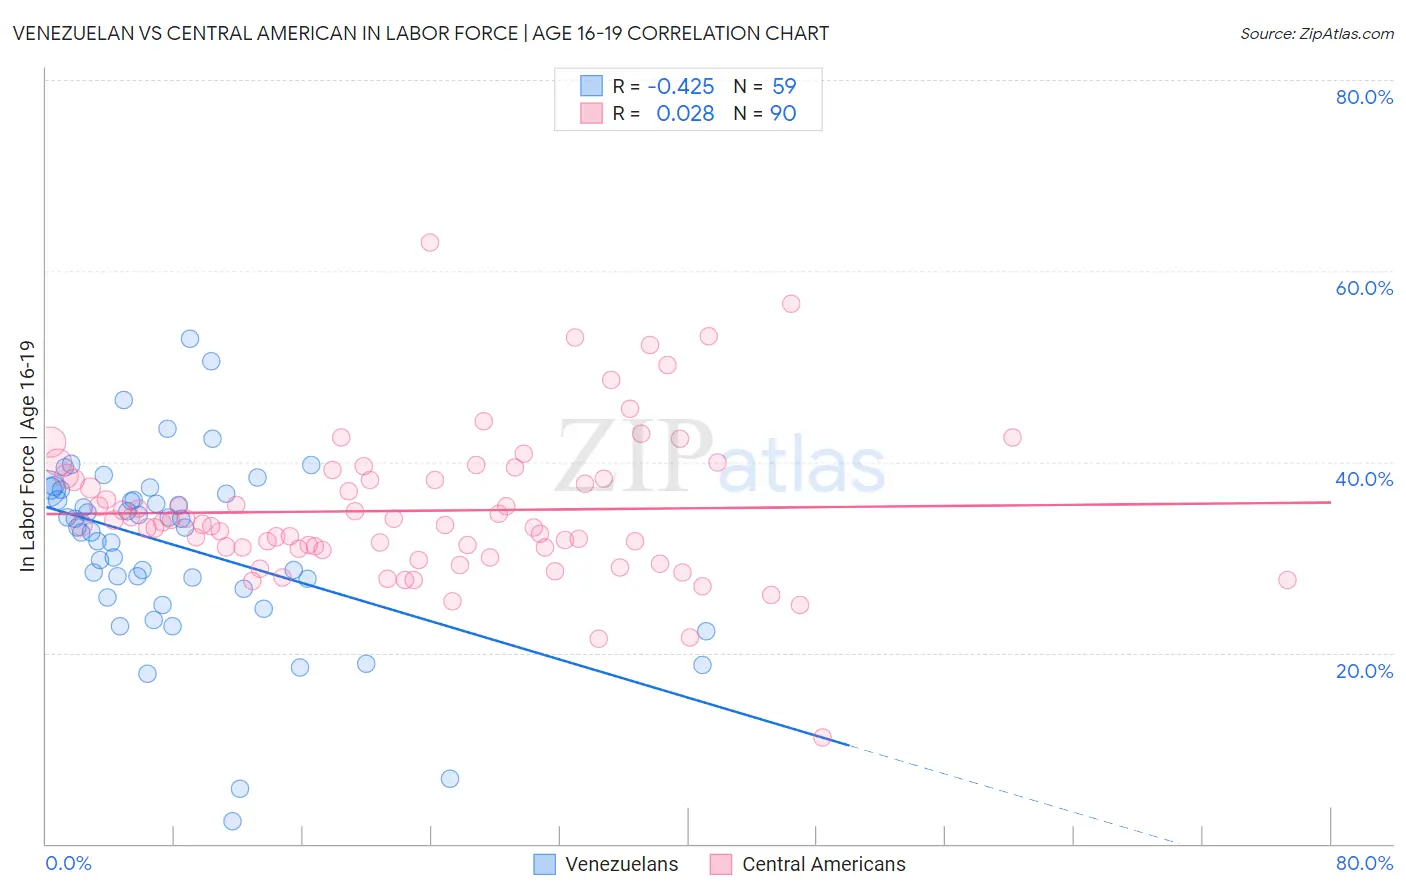
Venezuelan vs Central American In Labor Force | Age 16-19 Correlation Chart
The statistical analysis conducted on geographies consisting of 306,036,928 people shows a moderate negative correlation between the proportion of Venezuelans and labor force participation rate among population between the ages 16 and 19 in the United States with a correlation coefficient (R) of -0.425 and weighted average of 34.0%. Similarly, the statistical analysis conducted on geographies consisting of 503,353,635 people shows no correlation between the proportion of Central Americans and labor force participation rate among population between the ages 16 and 19 in the United States with a correlation coefficient (R) of 0.028 and weighted average of 34.8%, a difference of 2.6%.
In Labor Force | Age 16-19 Correlation Summary
| Measurement | Venezuelan | Central American |
| Minimum | 2.4% | 11.1% |
| Maximum | 52.9% | 63.0% |
| Range | 50.5% | 51.9% |
| Mean | 31.2% | 34.9% |
| Median | 33.1% | 33.4% |
| Interquartile 25% (IQ1) | 26.7% | 31.0% |
| Interquartile 75% (IQ3) | 37.1% | 38.2% |
| Interquartile Range (IQR) | 10.4% | 7.2% |
| Standard Deviation (Sample) | 9.6% | 7.8% |
| Standard Deviation (Population) | 9.5% | 7.8% |
Similar Demographics by In Labor Force | Age 16-19
Demographics Similar to Venezuelans by In Labor Force | Age 16-19
In terms of in labor force | age 16-19, the demographic groups most similar to Venezuelans are Immigrants from Panama (34.0%, a difference of 0.090%), Immigrants from Fiji (33.9%, a difference of 0.090%), Immigrants from Latin America (33.9%, a difference of 0.20%), Asian (34.1%, a difference of 0.31%), and Menominee (33.9%, a difference of 0.31%).
| Demographics | Rating | Rank | In Labor Force | Age 16-19 |
| Immigrants | Peru | 0.5 /100 | #267 | Tragic 34.2% |
| Immigrants | Asia | 0.5 /100 | #268 | Tragic 34.1% |
| Pima | 0.5 /100 | #269 | Tragic 34.1% |
| Immigrants | Russia | 0.4 /100 | #270 | Tragic 34.1% |
| Central American Indians | 0.4 /100 | #271 | Tragic 34.1% |
| Asians | 0.4 /100 | #272 | Tragic 34.1% |
| Immigrants | Panama | 0.4 /100 | #273 | Tragic 34.0% |
| Venezuelans | 0.3 /100 | #274 | Tragic 34.0% |
| Immigrants | Fiji | 0.3 /100 | #275 | Tragic 33.9% |
| Immigrants | Latin America | 0.3 /100 | #276 | Tragic 33.9% |
| Menominee | 0.3 /100 | #277 | Tragic 33.9% |
| Colombians | 0.3 /100 | #278 | Tragic 33.8% |
| Paraguayans | 0.3 /100 | #279 | Tragic 33.8% |
| Taiwanese | 0.3 /100 | #280 | Tragic 33.8% |
| Cypriots | 0.3 /100 | #281 | Tragic 33.8% |
Demographics Similar to Central Americans by In Labor Force | Age 16-19
In terms of in labor force | age 16-19, the demographic groups most similar to Central Americans are Immigrants from Ukraine (34.8%, a difference of 0.030%), Immigrants from Sri Lanka (34.9%, a difference of 0.090%), Laotian (34.9%, a difference of 0.090%), Immigrants from Greece (34.9%, a difference of 0.12%), and Immigrants from Pakistan (34.8%, a difference of 0.13%).
| Demographics | Rating | Rank | In Labor Force | Age 16-19 |
| Immigrants | Ireland | 2.9 /100 | #241 | Tragic 35.0% |
| Uruguayans | 2.6 /100 | #242 | Tragic 34.9% |
| Pueblo | 2.6 /100 | #243 | Tragic 34.9% |
| Immigrants | Turkey | 2.6 /100 | #244 | Tragic 34.9% |
| Immigrants | Greece | 2.4 /100 | #245 | Tragic 34.9% |
| Immigrants | Sri Lanka | 2.4 /100 | #246 | Tragic 34.9% |
| Laotians | 2.4 /100 | #247 | Tragic 34.9% |
| Central Americans | 2.2 /100 | #248 | Tragic 34.8% |
| Immigrants | Ukraine | 2.2 /100 | #249 | Tragic 34.8% |
| Immigrants | Pakistan | 2.0 /100 | #250 | Tragic 34.8% |
| Immigrants | Western Asia | 2.0 /100 | #251 | Tragic 34.8% |
| Immigrants | Chile | 2.0 /100 | #252 | Tragic 34.8% |
| Immigrants | Japan | 1.5 /100 | #253 | Tragic 34.7% |
| Bahamians | 1.4 /100 | #254 | Tragic 34.6% |
| Peruvians | 1.4 /100 | #255 | Tragic 34.6% |