Uruguayan vs Immigrants from Panama In Labor Force | Age 25-29
COMPARE
Uruguayan
Immigrants from Panama
In Labor Force | Age 25-29
In Labor Force | Age 25-29 Comparison
Uruguayans
Immigrants from Panama
84.9%
IN LABOR FORCE | AGE 25-29
84.7/ 100
METRIC RATING
125th/ 347
METRIC RANK
84.2%
IN LABOR FORCE | AGE 25-29
5.5/ 100
METRIC RATING
228th/ 347
METRIC RANK
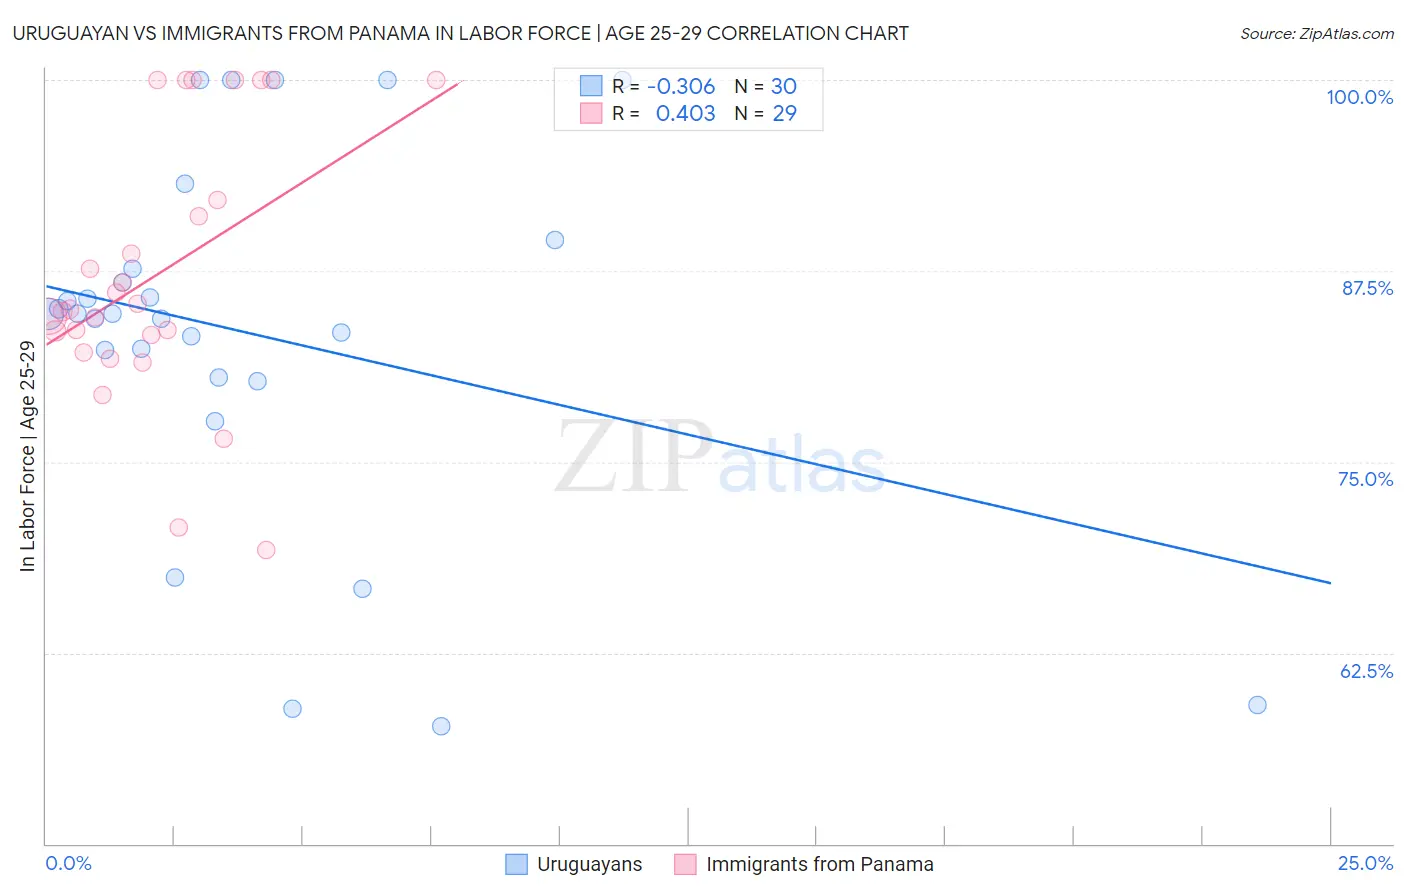
Uruguayan vs Immigrants from Panama In Labor Force | Age 25-29 Correlation Chart
The statistical analysis conducted on geographies consisting of 144,778,510 people shows a mild negative correlation between the proportion of Uruguayans and labor force participation rate among population between the ages 25 and 29 in the United States with a correlation coefficient (R) of -0.306 and weighted average of 84.9%. Similarly, the statistical analysis conducted on geographies consisting of 221,168,599 people shows a moderate positive correlation between the proportion of Immigrants from Panama and labor force participation rate among population between the ages 25 and 29 in the United States with a correlation coefficient (R) of 0.403 and weighted average of 84.2%, a difference of 0.84%.
In Labor Force | Age 25-29 Correlation Summary
| Measurement | Uruguayan | Immigrants from Panama |
| Minimum | 57.7% | 69.2% |
| Maximum | 100.0% | 100.0% |
| Range | 42.3% | 30.8% |
| Mean | 83.4% | 87.3% |
| Median | 84.7% | 85.0% |
| Interquartile 25% (IQ1) | 80.5% | 82.7% |
| Interquartile 75% (IQ3) | 87.6% | 96.1% |
| Interquartile Range (IQR) | 7.1% | 13.4% |
| Standard Deviation (Sample) | 11.8% | 8.7% |
| Standard Deviation (Population) | 11.6% | 8.6% |
Similar Demographics by In Labor Force | Age 25-29
Demographics Similar to Uruguayans by In Labor Force | Age 25-29
In terms of in labor force | age 25-29, the demographic groups most similar to Uruguayans are Dutch (84.9%, a difference of 0.0%), Immigrants from Iran (84.9%, a difference of 0.0%), Immigrants from Singapore (84.9%, a difference of 0.0%), Immigrants from Chile (84.9%, a difference of 0.010%), and Scandinavian (84.9%, a difference of 0.010%).
| Demographics | Rating | Rank | In Labor Force | Age 25-29 |
| Finns | 87.8 /100 | #118 | Excellent 85.0% |
| Filipinos | 87.1 /100 | #119 | Excellent 84.9% |
| Immigrants | South Africa | 86.1 /100 | #120 | Excellent 84.9% |
| Immigrants | Chile | 85.6 /100 | #121 | Excellent 84.9% |
| Scandinavians | 85.1 /100 | #122 | Excellent 84.9% |
| Dutch | 84.9 /100 | #123 | Excellent 84.9% |
| Immigrants | Iran | 84.8 /100 | #124 | Excellent 84.9% |
| Uruguayans | 84.7 /100 | #125 | Excellent 84.9% |
| Immigrants | Singapore | 84.4 /100 | #126 | Excellent 84.9% |
| Immigrants | Uruguay | 84.0 /100 | #127 | Excellent 84.9% |
| Australians | 83.6 /100 | #128 | Excellent 84.9% |
| Immigrants | Russia | 81.6 /100 | #129 | Excellent 84.9% |
| Northern Europeans | 81.3 /100 | #130 | Excellent 84.9% |
| Iranians | 78.1 /100 | #131 | Good 84.8% |
| Romanians | 77.7 /100 | #132 | Good 84.8% |
Demographics Similar to Immigrants from Panama by In Labor Force | Age 25-29
In terms of in labor force | age 25-29, the demographic groups most similar to Immigrants from Panama are French American Indian (84.2%, a difference of 0.0%), Korean (84.2%, a difference of 0.010%), Immigrants from Congo (84.2%, a difference of 0.010%), Immigrants from West Indies (84.2%, a difference of 0.020%), and Immigrants from Oceania (84.2%, a difference of 0.020%).
| Demographics | Rating | Rank | In Labor Force | Age 25-29 |
| Arabs | 6.8 /100 | #221 | Tragic 84.2% |
| Jordanians | 6.7 /100 | #222 | Tragic 84.2% |
| Scotch-Irish | 6.5 /100 | #223 | Tragic 84.2% |
| Immigrants | West Indies | 6.0 /100 | #224 | Tragic 84.2% |
| Koreans | 5.9 /100 | #225 | Tragic 84.2% |
| Immigrants | Congo | 5.8 /100 | #226 | Tragic 84.2% |
| French American Indians | 5.5 /100 | #227 | Tragic 84.2% |
| Immigrants | Panama | 5.5 /100 | #228 | Tragic 84.2% |
| Immigrants | Oceania | 5.0 /100 | #229 | Tragic 84.2% |
| Whites/Caucasians | 4.8 /100 | #230 | Tragic 84.2% |
| Immigrants | Philippines | 4.7 /100 | #231 | Tragic 84.2% |
| Panamanians | 4.5 /100 | #232 | Tragic 84.2% |
| Immigrants | Western Asia | 2.7 /100 | #233 | Tragic 84.1% |
| Barbadians | 1.0 /100 | #234 | Tragic 83.9% |
| Iraqis | 0.9 /100 | #235 | Tragic 83.9% |