Uruguayan vs Immigrants from Dominican Republic In Labor Force | Age 45-54
COMPARE
Uruguayan
Immigrants from Dominican Republic
In Labor Force | Age 45-54
In Labor Force | Age 45-54 Comparison
Uruguayans
Immigrants from Dominican Republic
83.1%
IN LABOR FORCE | AGE 45-54
89.4/ 100
METRIC RATING
121st/ 347
METRIC RANK
80.1%
IN LABOR FORCE | AGE 45-54
0.0/ 100
METRIC RATING
305th/ 347
METRIC RANK
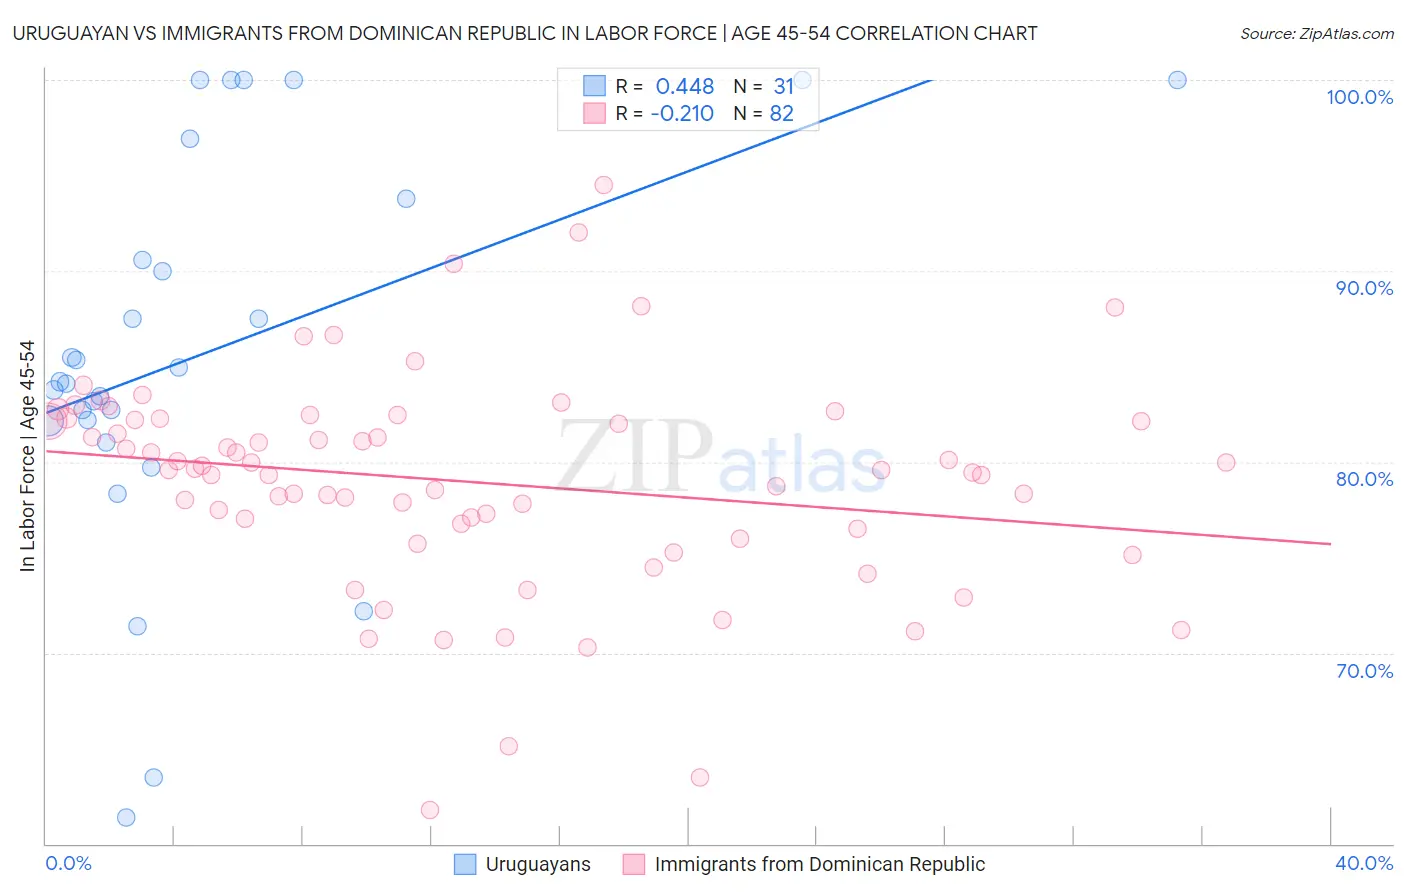
Uruguayan vs Immigrants from Dominican Republic In Labor Force | Age 45-54 Correlation Chart
The statistical analysis conducted on geographies consisting of 144,763,514 people shows a moderate positive correlation between the proportion of Uruguayans and labor force participation rate among population between the ages 45 and 54 in the United States with a correlation coefficient (R) of 0.448 and weighted average of 83.1%. Similarly, the statistical analysis conducted on geographies consisting of 274,956,720 people shows a weak negative correlation between the proportion of Immigrants from Dominican Republic and labor force participation rate among population between the ages 45 and 54 in the United States with a correlation coefficient (R) of -0.210 and weighted average of 80.1%, a difference of 3.8%.
In Labor Force | Age 45-54 Correlation Summary
| Measurement | Uruguayan | Immigrants from Dominican Republic |
| Minimum | 61.4% | 61.8% |
| Maximum | 100.0% | 94.5% |
| Range | 38.6% | 32.7% |
| Mean | 85.7% | 79.0% |
| Median | 84.2% | 79.6% |
| Interquartile 25% (IQ1) | 82.1% | 76.5% |
| Interquartile 75% (IQ3) | 93.8% | 82.2% |
| Interquartile Range (IQR) | 11.7% | 5.7% |
| Standard Deviation (Sample) | 10.2% | 5.7% |
| Standard Deviation (Population) | 10.0% | 5.6% |
Similar Demographics by In Labor Force | Age 45-54
Demographics Similar to Uruguayans by In Labor Force | Age 45-54
In terms of in labor force | age 45-54, the demographic groups most similar to Uruguayans are Immigrants from Vietnam (83.1%, a difference of 0.010%), Immigrants from Uruguay (83.2%, a difference of 0.020%), Immigrants from Russia (83.2%, a difference of 0.020%), Tongan (83.1%, a difference of 0.020%), and Immigrants from Europe (83.2%, a difference of 0.030%).
| Demographics | Rating | Rank | In Labor Force | Age 45-54 |
| Assyrians/Chaldeans/Syriacs | 91.7 /100 | #114 | Exceptional 83.2% |
| Immigrants | Chile | 91.6 /100 | #115 | Exceptional 83.2% |
| Immigrants | Malaysia | 91.4 /100 | #116 | Exceptional 83.2% |
| Immigrants | China | 90.9 /100 | #117 | Exceptional 83.2% |
| Immigrants | Europe | 90.7 /100 | #118 | Exceptional 83.2% |
| Immigrants | Uruguay | 90.2 /100 | #119 | Exceptional 83.2% |
| Immigrants | Russia | 90.1 /100 | #120 | Exceptional 83.2% |
| Uruguayans | 89.4 /100 | #121 | Excellent 83.1% |
| Immigrants | Vietnam | 88.9 /100 | #122 | Excellent 83.1% |
| Tongans | 88.2 /100 | #123 | Excellent 83.1% |
| Bermudans | 88.0 /100 | #124 | Excellent 83.1% |
| Immigrants | Iran | 87.2 /100 | #125 | Excellent 83.1% |
| Immigrants | Belgium | 86.4 /100 | #126 | Excellent 83.1% |
| Immigrants | Jordan | 85.2 /100 | #127 | Excellent 83.1% |
| Germans | 85.1 /100 | #128 | Excellent 83.1% |
Demographics Similar to Immigrants from Dominican Republic by In Labor Force | Age 45-54
In terms of in labor force | age 45-54, the demographic groups most similar to Immigrants from Dominican Republic are Hispanic or Latino (80.1%, a difference of 0.010%), Immigrants from the Azores (80.1%, a difference of 0.030%), Spanish American (80.1%, a difference of 0.040%), Immigrants from Central America (80.2%, a difference of 0.090%), and Blackfeet (80.0%, a difference of 0.12%).
| Demographics | Rating | Rank | In Labor Force | Age 45-54 |
| Marshallese | 0.0 /100 | #298 | Tragic 80.3% |
| Dominicans | 0.0 /100 | #299 | Tragic 80.3% |
| Fijians | 0.0 /100 | #300 | Tragic 80.2% |
| Spanish American Indians | 0.0 /100 | #301 | Tragic 80.2% |
| Immigrants | Central America | 0.0 /100 | #302 | Tragic 80.2% |
| Immigrants | Azores | 0.0 /100 | #303 | Tragic 80.1% |
| Hispanics or Latinos | 0.0 /100 | #304 | Tragic 80.1% |
| Immigrants | Dominican Republic | 0.0 /100 | #305 | Tragic 80.1% |
| Spanish Americans | 0.0 /100 | #306 | Tragic 80.1% |
| Blackfeet | 0.0 /100 | #307 | Tragic 80.0% |
| Central American Indians | 0.0 /100 | #308 | Tragic 80.0% |
| Potawatomi | 0.0 /100 | #309 | Tragic 80.0% |
| Inupiat | 0.0 /100 | #310 | Tragic 79.9% |
| Mexicans | 0.0 /100 | #311 | Tragic 79.8% |
| Immigrants | Mexico | 0.0 /100 | #312 | Tragic 79.7% |