Tohono O'odham vs Ghanaian In Labor Force | Age 20-24
COMPARE
Tohono O'odham
Ghanaian
In Labor Force | Age 20-24
In Labor Force | Age 20-24 Comparison
Tohono O'odham
Ghanaians
68.6%
IN LABOR FORCE | AGE 20-24
0.0/ 100
METRIC RATING
341st/ 347
METRIC RANK
74.3%
IN LABOR FORCE | AGE 20-24
6.2/ 100
METRIC RATING
225th/ 347
METRIC RANK
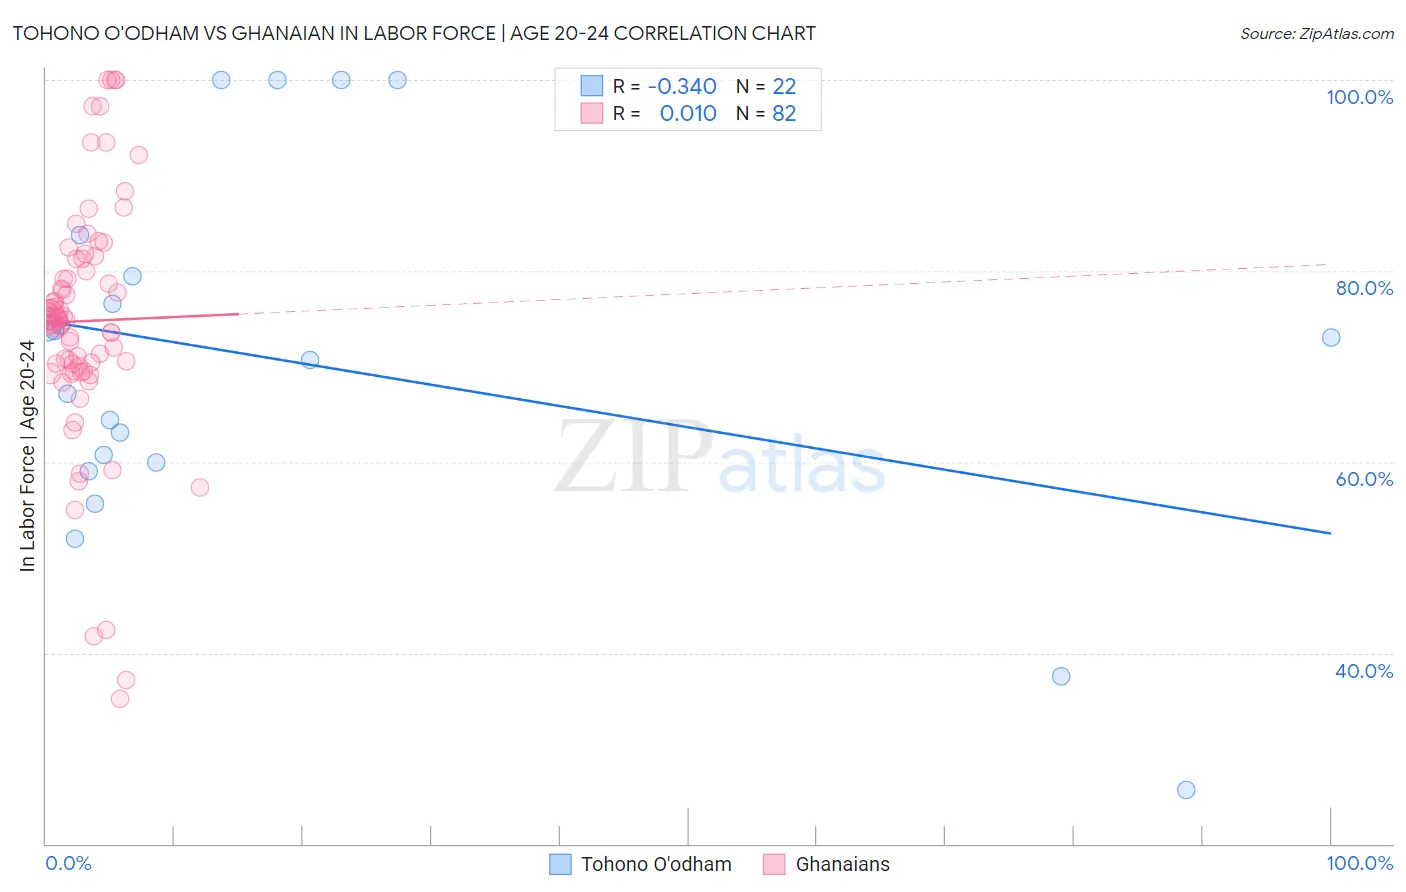
Tohono O'odham vs Ghanaian In Labor Force | Age 20-24 Correlation Chart
The statistical analysis conducted on geographies consisting of 58,720,073 people shows a mild negative correlation between the proportion of Tohono O'odham and labor force participation rate among population between the ages 20 and 24 in the United States with a correlation coefficient (R) of -0.340 and weighted average of 68.6%. Similarly, the statistical analysis conducted on geographies consisting of 190,718,461 people shows no correlation between the proportion of Ghanaians and labor force participation rate among population between the ages 20 and 24 in the United States with a correlation coefficient (R) of 0.010 and weighted average of 74.3%, a difference of 8.3%.
In Labor Force | Age 20-24 Correlation Summary
| Measurement | Tohono O'odham | Ghanaian |
| Minimum | 25.6% | 35.2% |
| Maximum | 100.0% | 100.0% |
| Range | 74.4% | 64.8% |
| Mean | 70.5% | 74.7% |
| Median | 71.9% | 75.1% |
| Interquartile 25% (IQ1) | 59.9% | 70.0% |
| Interquartile 75% (IQ3) | 79.5% | 81.3% |
| Interquartile Range (IQR) | 19.6% | 11.3% |
| Standard Deviation (Sample) | 19.4% | 12.7% |
| Standard Deviation (Population) | 19.0% | 12.6% |
Similar Demographics by In Labor Force | Age 20-24
Demographics Similar to Tohono O'odham by In Labor Force | Age 20-24
In terms of in labor force | age 20-24, the demographic groups most similar to Tohono O'odham are Menominee (68.7%, a difference of 0.13%), Immigrants from St. Vincent and the Grenadines (68.4%, a difference of 0.31%), Puerto Rican (68.3%, a difference of 0.43%), Immigrants from Yemen (68.9%, a difference of 0.44%), and Pima (69.0%, a difference of 0.57%).
| Demographics | Rating | Rank | In Labor Force | Age 20-24 |
| Yuman | 0.0 /100 | #333 | Tragic 70.3% |
| British West Indians | 0.0 /100 | #334 | Tragic 70.0% |
| Immigrants | Barbados | 0.0 /100 | #335 | Tragic 69.7% |
| Immigrants | Guyana | 0.0 /100 | #336 | Tragic 69.3% |
| Guyanese | 0.0 /100 | #337 | Tragic 69.2% |
| Pima | 0.0 /100 | #338 | Tragic 69.0% |
| Immigrants | Yemen | 0.0 /100 | #339 | Tragic 68.9% |
| Menominee | 0.0 /100 | #340 | Tragic 68.7% |
| Tohono O'odham | 0.0 /100 | #341 | Tragic 68.6% |
| Immigrants | St. Vincent and the Grenadines | 0.0 /100 | #342 | Tragic 68.4% |
| Puerto Ricans | 0.0 /100 | #343 | Tragic 68.3% |
| Immigrants | Grenada | 0.0 /100 | #344 | Tragic 67.2% |
| Hopi | 0.0 /100 | #345 | Tragic 66.0% |
| Lumbee | 0.0 /100 | #346 | Tragic 65.5% |
| Navajo | 0.0 /100 | #347 | Tragic 64.8% |
Demographics Similar to Ghanaians by In Labor Force | Age 20-24
In terms of in labor force | age 20-24, the demographic groups most similar to Ghanaians are Immigrants from Fiji (74.3%, a difference of 0.020%), Immigrants from Ireland (74.3%, a difference of 0.030%), Seminole (74.3%, a difference of 0.040%), Immigrants from Ukraine (74.2%, a difference of 0.080%), and Hispanic or Latino (74.4%, a difference of 0.10%).
| Demographics | Rating | Rank | In Labor Force | Age 20-24 |
| Immigrants | Peru | 10.6 /100 | #218 | Poor 74.5% |
| Nepalese | 10.5 /100 | #219 | Poor 74.5% |
| Immigrants | Norway | 10.3 /100 | #220 | Poor 74.5% |
| Chickasaw | 10.3 /100 | #221 | Poor 74.5% |
| Immigrants | India | 9.9 /100 | #222 | Tragic 74.4% |
| Hispanics or Latinos | 7.9 /100 | #223 | Tragic 74.4% |
| Seminole | 6.9 /100 | #224 | Tragic 74.3% |
| Ghanaians | 6.2 /100 | #225 | Tragic 74.3% |
| Immigrants | Fiji | 5.9 /100 | #226 | Tragic 74.3% |
| Immigrants | Ireland | 5.8 /100 | #227 | Tragic 74.3% |
| Immigrants | Ukraine | 5.1 /100 | #228 | Tragic 74.2% |
| Immigrants | Sweden | 4.6 /100 | #229 | Tragic 74.2% |
| Immigrants | Albania | 4.3 /100 | #230 | Tragic 74.2% |
| Immigrants | Greece | 4.1 /100 | #231 | Tragic 74.2% |
| Immigrants | Switzerland | 4.1 /100 | #232 | Tragic 74.2% |