Thai vs Cape Verdean In Labor Force | Age 16-19
COMPARE
Thai
Cape Verdean
In Labor Force | Age 16-19
In Labor Force | Age 16-19 Comparison
Thais
Cape Verdeans
34.6%
IN LABOR FORCE | AGE 16-19
1.2/ 100
METRIC RATING
258th/ 347
METRIC RANK
44.5%
IN LABOR FORCE | AGE 16-19
100.0/ 100
METRIC RATING
9th/ 347
METRIC RANK
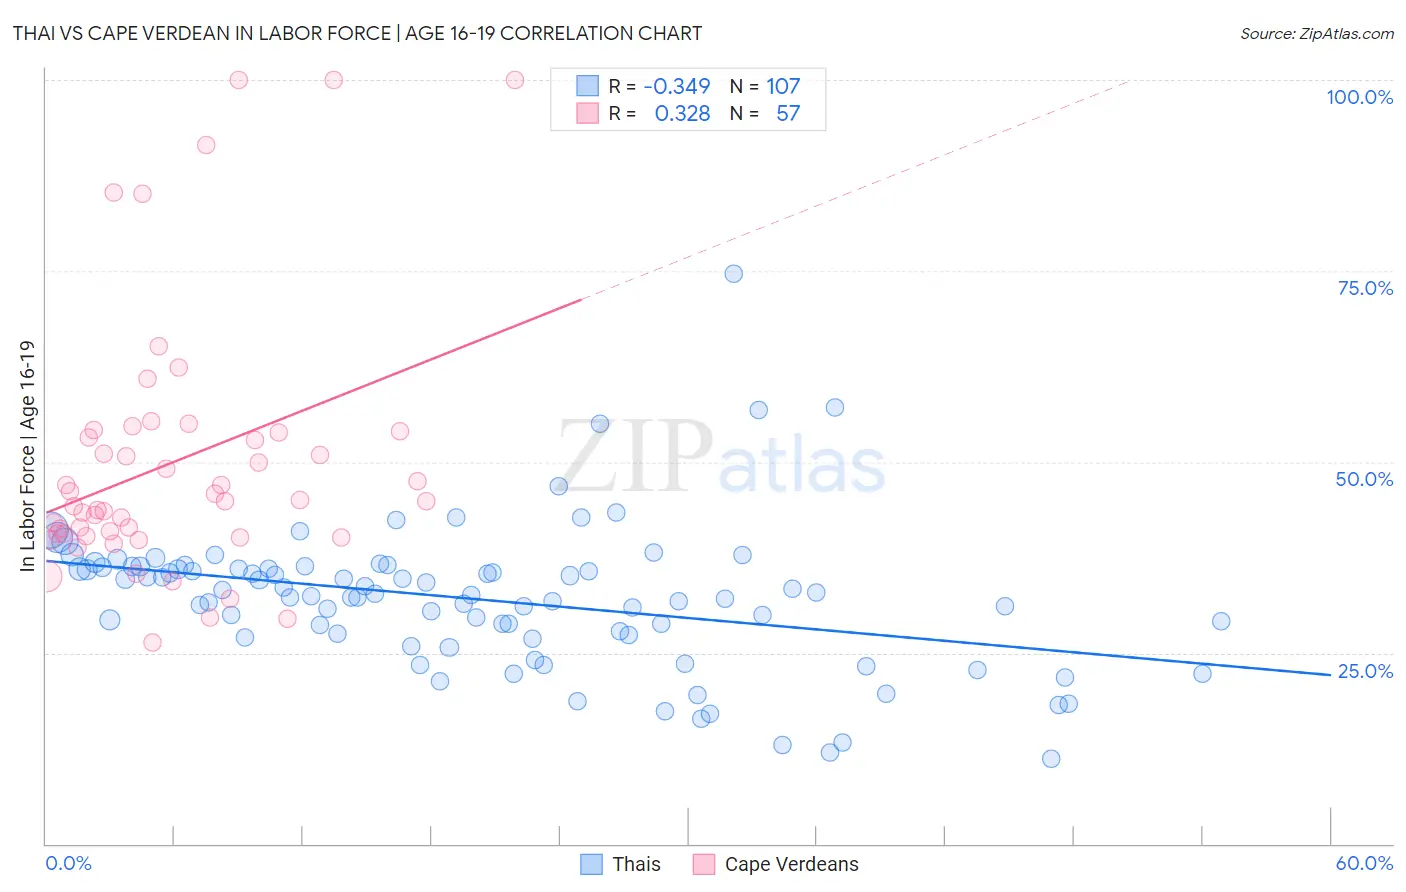
Thai vs Cape Verdean In Labor Force | Age 16-19 Correlation Chart
The statistical analysis conducted on geographies consisting of 474,909,482 people shows a mild negative correlation between the proportion of Thais and labor force participation rate among population between the ages 16 and 19 in the United States with a correlation coefficient (R) of -0.349 and weighted average of 34.6%. Similarly, the statistical analysis conducted on geographies consisting of 107,547,633 people shows a mild positive correlation between the proportion of Cape Verdeans and labor force participation rate among population between the ages 16 and 19 in the United States with a correlation coefficient (R) of 0.328 and weighted average of 44.5%, a difference of 28.7%.
In Labor Force | Age 16-19 Correlation Summary
| Measurement | Thai | Cape Verdean |
| Minimum | 11.1% | 26.3% |
| Maximum | 74.6% | 100.0% |
| Range | 63.5% | 73.7% |
| Mean | 32.0% | 50.0% |
| Median | 32.6% | 44.9% |
| Interquartile 25% (IQ1) | 27.3% | 40.4% |
| Interquartile 75% (IQ3) | 36.2% | 53.9% |
| Interquartile Range (IQR) | 9.0% | 13.5% |
| Standard Deviation (Sample) | 9.4% | 17.1% |
| Standard Deviation (Population) | 9.4% | 17.0% |
Similar Demographics by In Labor Force | Age 16-19
Demographics Similar to Thais by In Labor Force | Age 16-19
In terms of in labor force | age 16-19, the demographic groups most similar to Thais are Immigrants from South Central Asia (34.6%, a difference of 0.010%), Immigrants from Egypt (34.6%, a difference of 0.010%), Immigrants (34.6%, a difference of 0.020%), Egyptian (34.5%, a difference of 0.10%), and Peruvian (34.6%, a difference of 0.12%).
| Demographics | Rating | Rank | In Labor Force | Age 16-19 |
| Immigrants | Western Asia | 2.0 /100 | #251 | Tragic 34.8% |
| Immigrants | Chile | 2.0 /100 | #252 | Tragic 34.8% |
| Immigrants | Japan | 1.5 /100 | #253 | Tragic 34.7% |
| Bahamians | 1.4 /100 | #254 | Tragic 34.6% |
| Peruvians | 1.4 /100 | #255 | Tragic 34.6% |
| Immigrants | South Central Asia | 1.3 /100 | #256 | Tragic 34.6% |
| Immigrants | Egypt | 1.2 /100 | #257 | Tragic 34.6% |
| Thais | 1.2 /100 | #258 | Tragic 34.6% |
| Immigrants | Immigrants | 1.2 /100 | #259 | Tragic 34.6% |
| Egyptians | 1.2 /100 | #260 | Tragic 34.5% |
| Salvadorans | 1.1 /100 | #261 | Tragic 34.5% |
| Hispanics or Latinos | 1.1 /100 | #262 | Tragic 34.5% |
| Burmese | 1.1 /100 | #263 | Tragic 34.5% |
| Immigrants | Uruguay | 0.9 /100 | #264 | Tragic 34.4% |
| Immigrants | El Salvador | 0.7 /100 | #265 | Tragic 34.3% |
Demographics Similar to Cape Verdeans by In Labor Force | Age 16-19
In terms of in labor force | age 16-19, the demographic groups most similar to Cape Verdeans are Immigrants from Cabo Verde (44.7%, a difference of 0.42%), Danish (44.7%, a difference of 0.46%), German (44.2%, a difference of 0.74%), Swedish (44.1%, a difference of 0.82%), and Finnish (43.9%, a difference of 1.3%).
| Demographics | Rating | Rank | In Labor Force | Age 16-19 |
| Norwegians | 100.0 /100 | #2 | Exceptional 46.2% |
| Immigrants | Somalia | 100.0 /100 | #3 | Exceptional 45.6% |
| Luxembourgers | 100.0 /100 | #4 | Exceptional 45.3% |
| Alaskan Athabascans | 100.0 /100 | #5 | Exceptional 45.2% |
| Somalis | 100.0 /100 | #6 | Exceptional 45.1% |
| Danes | 100.0 /100 | #7 | Exceptional 44.7% |
| Immigrants | Cabo Verde | 100.0 /100 | #8 | Exceptional 44.7% |
| Cape Verdeans | 100.0 /100 | #9 | Exceptional 44.5% |
| Germans | 100.0 /100 | #10 | Exceptional 44.2% |
| Swedes | 100.0 /100 | #11 | Exceptional 44.1% |
| Finns | 100.0 /100 | #12 | Exceptional 43.9% |
| Dutch | 100.0 /100 | #13 | Exceptional 43.8% |
| Chippewa | 100.0 /100 | #14 | Exceptional 43.8% |
| Slovenes | 100.0 /100 | #15 | Exceptional 43.7% |
| Czechs | 100.0 /100 | #16 | Exceptional 43.6% |