Taiwanese vs Immigrants from Philippines In Labor Force | Age 20-64

COMPARE

Taiwanese
Race
Ancestry
AfghanAfricanAlaska NativeAlaskan AthabascanAlbanianAleutAlsatianAmericanApacheArabArapahoArgentineanArmenianAssyrian/Chaldean/SyriacAustralianAustrianBahamianBangladeshiBarbadianBasqueBelgianBelizeanBermudanBhutaneseBlackfeetBolivianBrazilianBritishBritish West IndianBulgarianBurmeseCajunCambodianCanadianCape VerdeanCarpatho RusynCelticCentral AmericanCentral American IndianCherokeeCheyenneChickasawChileanChineseChippewaChoctawColombianColvilleComancheCosta RicanCreeCreekCroatianCrowCubanCypriotCzechCzechoslovakianDanishDelawareDominicanDutchDutch West IndianEastern EuropeanEcuadorianEgyptianEnglishEstonianEthiopianEuropeanFijianFilipinoFinnishFrenchFrench American IndianFrench CanadianGermanGerman RussianGhanaianGreekGuamanian/ChamorroGuatemalanGuyaneseHaitianHmongHonduranHopiHoumaHungarianIcelanderIndian (Asian)IndonesianInupiatIranianIraqiIrishIroquoisIsraeliItalianJamaicanJapaneseJordanianKenyanKiowaKoreanLaotianLatvianLebaneseLiberianLithuanianLumbeeLuxembourgerMacedonianMalaysianMalteseMarshalleseMenomineeMexicanMexican American IndianMongolianMoroccanNative HawaiianNavajoNepaleseNew ZealanderNicaraguanNigerianNorthern EuropeanNorwegianOkinawanOsageOttawaPaiutePakistaniPalestinianPanamanianParaguayanPennsylvania GermanPeruvianPimaPolishPortuguesePotawatomiPuebloPuerto RicanPuget Sound SalishRomanianRussianSalvadoranSamoanScandinavianScotch-IrishScottishSeminoleSenegaleseSerbianShoshoneSierra LeoneanSiouxSlavicSlovakSloveneSomaliSouth AfricanSouth AmericanSouth American IndianSoviet UnionSpaniardSpanishSpanish AmericanSpanish American IndianSri LankanSubsaharan AfricanSudaneseSwedishSwissSyrianTaiwaneseThaiTlingit-HaidaTohono O'OdhamTonganTrinidadian and TobagonianTsimshianTurkishU.S. Virgin IslanderUgandanUkrainianUruguayanUteVenezuelanVietnameseWelshWest IndianYakamaYaquiYugoslavianYumanYup'ikZimbabwean
Immigration
NonimmigrantsImmigrantsAfghanistanAfricaAlbaniaArgentinaArmeniaAsiaAustraliaAustriaBahamasBangladeshBarbadosBelarusBelgiumBelizeBoliviaBosnia and HerzegovinaBrazilBulgariaBurma/MyanmarCabo VerdeCambodiaCameroonCanadaCaribbeanCentral AmericaChileChinaColombiaCongoCosta RicaCroatiaCubaCzechoslovakiaDenmarkDominicaDominican RepublicEastern AfricaEastern AsiaEastern EuropeEcuadorEgyptEl SalvadorEnglandEritreaEthiopiaEuropeFijiFranceGermanyGhanaGreeceGrenadaGuatemalaGuyanaHaitiHondurasHong KongHungaryIndiaIndonesiaIranIraqIrelandIsraelItalyJamaicaJapanJordanKazakhstanKenyaKoreaKuwaitLaosLatin AmericaLatviaLebanonLiberiaLithuaniaMalaysiaMexicoMicronesiaMiddle AfricaMoldovaMoroccoNepalNetherlandsNicaraguaNigeriaNorth AmericaNorth MacedoniaNorthern AfricaNorthern EuropeNorwayOceaniaPakistanPanamaPeruPolandPortugalRomaniaRussiaSaudi ArabiaScotlandSenegalSerbiaSierra LeoneSingaporeSomaliaSouth AfricaSouth AmericaSouth Central AsiaSouth Eastern AsiaSouthern EuropeSpainSri LankaSt. Vincent and the GrenadinesSudanSwedenSwitzerlandSyriaTaiwanThailandTrinidad and TobagoTurkeyUgandaUkraineUruguayUzbekistanVenezuelaVietnamWest IndiesWestern AfricaWestern AsiaWestern EuropeYemenZaireZimbabweAzores
Immigrants from Philippines
Race
Ancestry
AfghanAfricanAlaska NativeAlaskan AthabascanAlbanianAleutAlsatianAmericanApacheArabArapahoArgentineanArmenianAssyrian/Chaldean/SyriacAustralianAustrianBahamianBangladeshiBarbadianBasqueBelgianBelizeanBermudanBhutaneseBlackfeetBolivianBrazilianBritishBritish West IndianBulgarianBurmeseCajunCambodianCanadianCape VerdeanCarpatho RusynCelticCentral AmericanCentral American IndianCherokeeCheyenneChickasawChileanChineseChippewaChoctawColombianColvilleComancheCosta RicanCreeCreekCroatianCrowCubanCypriotCzechCzechoslovakianDanishDelawareDominicanDutchDutch West IndianEastern EuropeanEcuadorianEgyptianEnglishEstonianEthiopianEuropeanFijianFilipinoFinnishFrenchFrench American IndianFrench CanadianGermanGerman RussianGhanaianGreekGuamanian/ChamorroGuatemalanGuyaneseHaitianHmongHonduranHopiHoumaHungarianIcelanderIndian (Asian)IndonesianInupiatIranianIraqiIrishIroquoisIsraeliItalianJamaicanJapaneseJordanianKenyanKiowaKoreanLaotianLatvianLebaneseLiberianLithuanianLumbeeLuxembourgerMacedonianMalaysianMalteseMarshalleseMenomineeMexicanMexican American IndianMongolianMoroccanNative HawaiianNavajoNepaleseNew ZealanderNicaraguanNigerianNorthern EuropeanNorwegianOkinawanOsageOttawaPaiutePakistaniPalestinianPanamanianParaguayanPennsylvania GermanPeruvianPimaPolishPortuguesePotawatomiPuebloPuerto RicanPuget Sound SalishRomanianRussianSalvadoranSamoanScandinavianScotch-IrishScottishSeminoleSenegaleseSerbianShoshoneSierra LeoneanSiouxSlavicSlovakSloveneSomaliSouth AfricanSouth AmericanSouth American IndianSoviet UnionSpaniardSpanishSpanish AmericanSpanish American IndianSri LankanSubsaharan AfricanSudaneseSwedishSwissSyrianThaiTlingit-HaidaTohono O'OdhamTonganTrinidadian and TobagonianTsimshianTurkishU.S. Virgin IslanderUgandanUkrainianUruguayanUteVenezuelanVietnameseWelshWest IndianYakamaYaquiYugoslavianYumanYup'ikZimbabwean
Immigration
NonimmigrantsImmigrantsAfghanistanAfricaAlbaniaArgentinaArmeniaAsiaAustraliaAustriaBahamasBangladeshBarbadosBelarusBelgiumBelizeBoliviaBosnia and HerzegovinaBrazilBulgariaBurma/MyanmarCabo VerdeCambodiaCameroonCanadaCaribbeanCentral AmericaChileChinaColombiaCongoCosta RicaCroatiaCubaCzechoslovakiaDenmarkDominicaDominican RepublicEastern AfricaEastern AsiaEastern EuropeEcuadorEgyptEl SalvadorEnglandEritreaEthiopiaEuropeFijiFranceGermanyGhanaGreeceGrenadaGuatemalaGuyanaHaitiHondurasHong KongHungaryIndiaIndonesiaIranIraqIrelandIsraelItalyJamaicaJapanJordanKazakhstanKenyaKoreaKuwaitLaosLatin AmericaLatviaLebanonLiberiaLithuaniaMalaysiaMexicoMicronesiaMiddle AfricaMoldovaMoroccoNepalNetherlandsNicaraguaNigeriaNorth AmericaNorth MacedoniaNorthern AfricaNorthern EuropeNorwayOceaniaPakistanPanamaPeruPhilippinesPolandPortugalRomaniaRussiaSaudi ArabiaScotlandSenegalSerbiaSierra LeoneSingaporeSomaliaSouth AfricaSouth AmericaSouth Central AsiaSouth Eastern AsiaSouthern EuropeSpainSri LankaSt. Vincent and the GrenadinesSudanSwedenSwitzerlandSyriaTaiwanThailandTrinidad and TobagoTurkeyUgandaUkraineUruguayUzbekistanVenezuelaVietnamWest IndiesWestern AfricaWestern AsiaWestern EuropeYemenZaireZimbabweAzores
In Labor Force | Age 20-64
Income
Poverty
Unemployment
Labor Participation
Family Structure
Vehicle Availability
Education Level
Disability

In Labor Force | Age 20-64 Comparison

Taiwanese

Immigrants from Philippines

Exceptional
Good
80.2%
IN LABOR FORCE | AGE 20-64
98.6/ 100
METRIC RATING
67th/ 347
METRIC RANK
79.8%
IN LABOR FORCE | AGE 20-64
78.0/ 100
METRIC RATING
147th/ 347
METRIC RANK

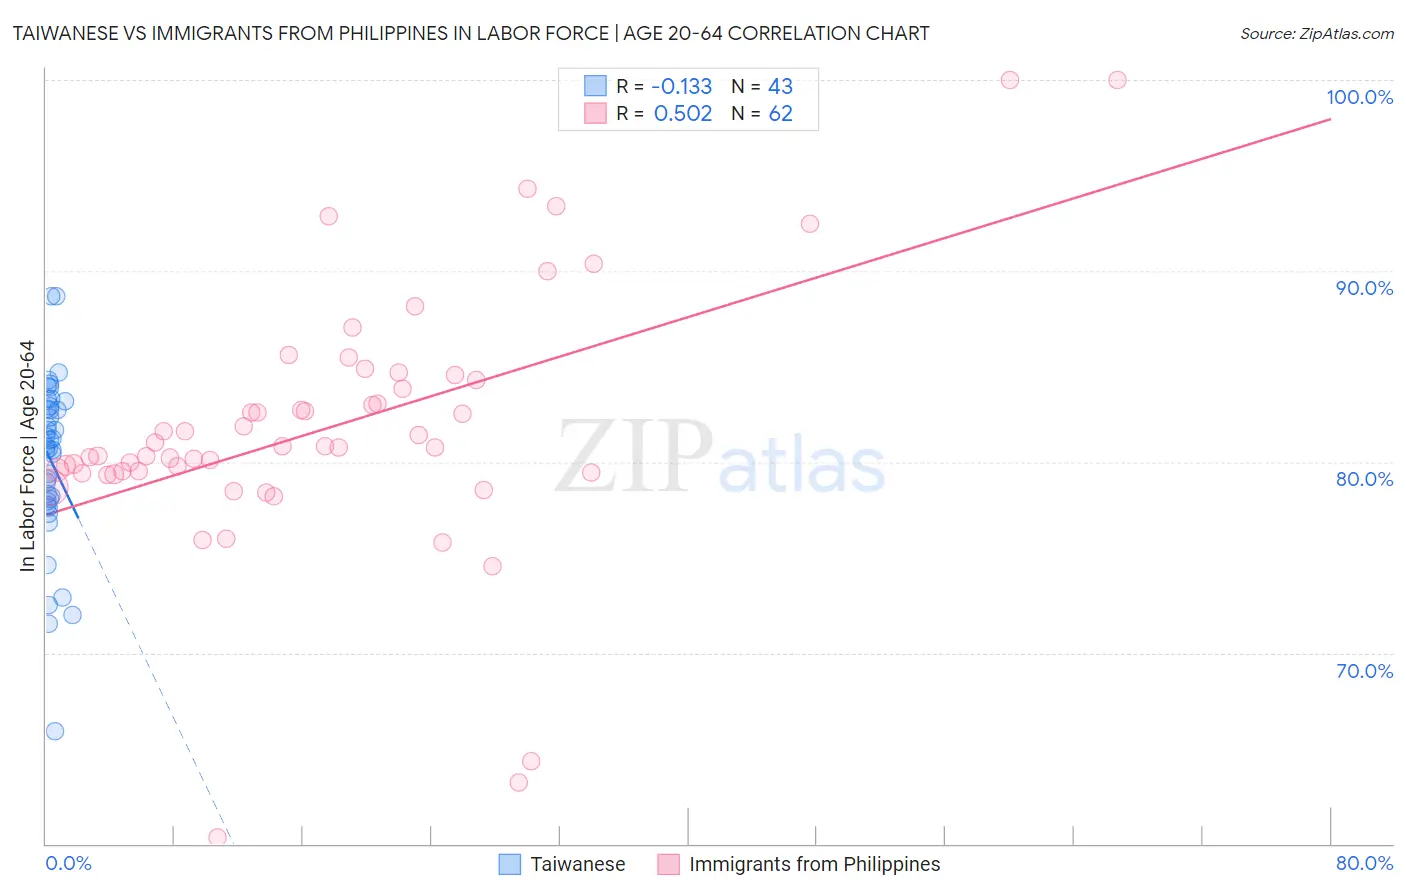
Taiwanese vs Immigrants from Philippines In Labor Force | Age 20-64 Correlation Chart

The statistical analysis conducted on geographies consisting of 31,724,466 people shows a poor negative correlation between the proportion of Taiwanese and labor force participation rate among population between the ages 20 and 64 in the United States with a correlation coefficient (R) of -0.133 and weighted average of 80.2%. Similarly, the statistical analysis conducted on geographies consisting of 471,289,372 people shows a substantial positive correlation between the proportion of Immigrants from Philippines and labor force participation rate among population between the ages 20 and 64 in the United States with a correlation coefficient (R) of 0.502 and weighted average of 79.8%, a difference of 0.60%.
Taiwanese vs Immigrants from Philippines In Labor Force | Age 20-64

In Labor Force | Age 20-64 Correlation Summary

MeasurementTaiwaneseImmigrants from Philippines
Minimum65.9%60.3%
Maximum88.7%100.0%
Range22.8%39.7%
Mean80.1%81.8%
Median80.8%80.8%
Interquartile 25% (IQ1)77.9%79.5%
Interquartile 75% (IQ3)82.9%84.3%
Interquartile Range (IQR)5.0%4.8%
Standard Deviation (Sample)4.5%6.9%
Standard Deviation (Population)4.4%6.8%

Similar Demographics by In Labor Force | Age 20-64

Demographics Similar to Taiwanese by In Labor Force | Age 20-64

In terms of in labor force | age 20-64, the demographic groups most similar to Taiwanese are Macedonian (80.2%, a difference of 0.0%), Immigrants from Albania (80.3%, a difference of 0.010%), Lithuanian (80.2%, a difference of 0.010%), Bhutanese (80.2%, a difference of 0.010%), and Albanian (80.2%, a difference of 0.010%).
DemographicsRating | RankIn Labor Force | Age 20-64
Tongans
98.8
/100
|
#60
Exceptional
80.3%
Burmese
98.8
/100
|
#61
Exceptional
80.3%
Carpatho Rusyns
98.8
/100
|
#62
Exceptional
80.3%
Immigrants | Korea
98.8
/100
|
#63
Exceptional
80.3%
Immigrants | Albania
98.7
/100
|
#64
Exceptional
80.3%
Lithuanians
98.7
/100
|
#65
Exceptional
80.2%
Macedonians
98.7
/100
|
#66
Exceptional
80.2%
Taiwanese
98.6
/100
|
#67
Exceptional
80.2%
Bhutanese
98.6
/100
|
#68
Exceptional
80.2%
Albanians
98.6
/100
|
#69
Exceptional
80.2%
Immigrants | Turkey
98.5
/100
|
#70
Exceptional
80.2%
Soviet Union
98.5
/100
|
#71
Exceptional
80.2%
Eastern Europeans
98.4
/100
|
#72
Exceptional
80.2%
Cypriots
98.2
/100
|
#73
Exceptional
80.2%
Immigrants | Eastern Europe
98.1
/100
|
#74
Exceptional
80.2%

Demographics Similar to Immigrants from Philippines by In Labor Force | Age 20-64

In terms of in labor force | age 20-64, the demographic groups most similar to Immigrants from Philippines are Romanian (79.8%, a difference of 0.0%), Immigrants from Southern Europe (79.8%, a difference of 0.010%), Immigrants from Israel (79.8%, a difference of 0.020%), Slovak (79.8%, a difference of 0.020%), and Immigrants from Sweden (79.8%, a difference of 0.020%).
DemographicsRating | RankIn Labor Force | Age 20-64
Immigrants | South Eastern Asia
80.4
/100
|
#140
Excellent
79.8%
Immigrants | Israel
80.0
/100
|
#141
Good
79.8%
Slovaks
79.9
/100
|
#142
Good
79.8%
Immigrants | Sweden
79.7
/100
|
#143
Good
79.8%
Koreans
79.6
/100
|
#144
Good
79.8%
Pakistanis
79.3
/100
|
#145
Good
79.8%
Immigrants | Southern Europe
78.9
/100
|
#146
Good
79.8%
Immigrants | Philippines
78.0
/100
|
#147
Good
79.8%
Romanians
77.6
/100
|
#148
Good
79.8%
Icelanders
75.1
/100
|
#149
Good
79.7%
Costa Ricans
72.4
/100
|
#150
Good
79.7%
Scandinavians
72.0
/100
|
#151
Good
79.7%
Immigrants | Northern Europe
72.0
/100
|
#152
Good
79.7%
Immigrants | Kazakhstan
69.5
/100
|
#153
Good
79.7%
New Zealanders
69.4
/100
|
#154
Good
79.7%