Spanish American vs Australian In Labor Force | Age 20-24
COMPARE
Spanish American
Australian
In Labor Force | Age 20-24
In Labor Force | Age 20-24 Comparison
Spanish Americans
Australians
75.8%
IN LABOR FORCE | AGE 20-24
94.8/ 100
METRIC RATING
118th/ 347
METRIC RANK
75.5%
IN LABOR FORCE | AGE 20-24
84.8/ 100
METRIC RATING
138th/ 347
METRIC RANK
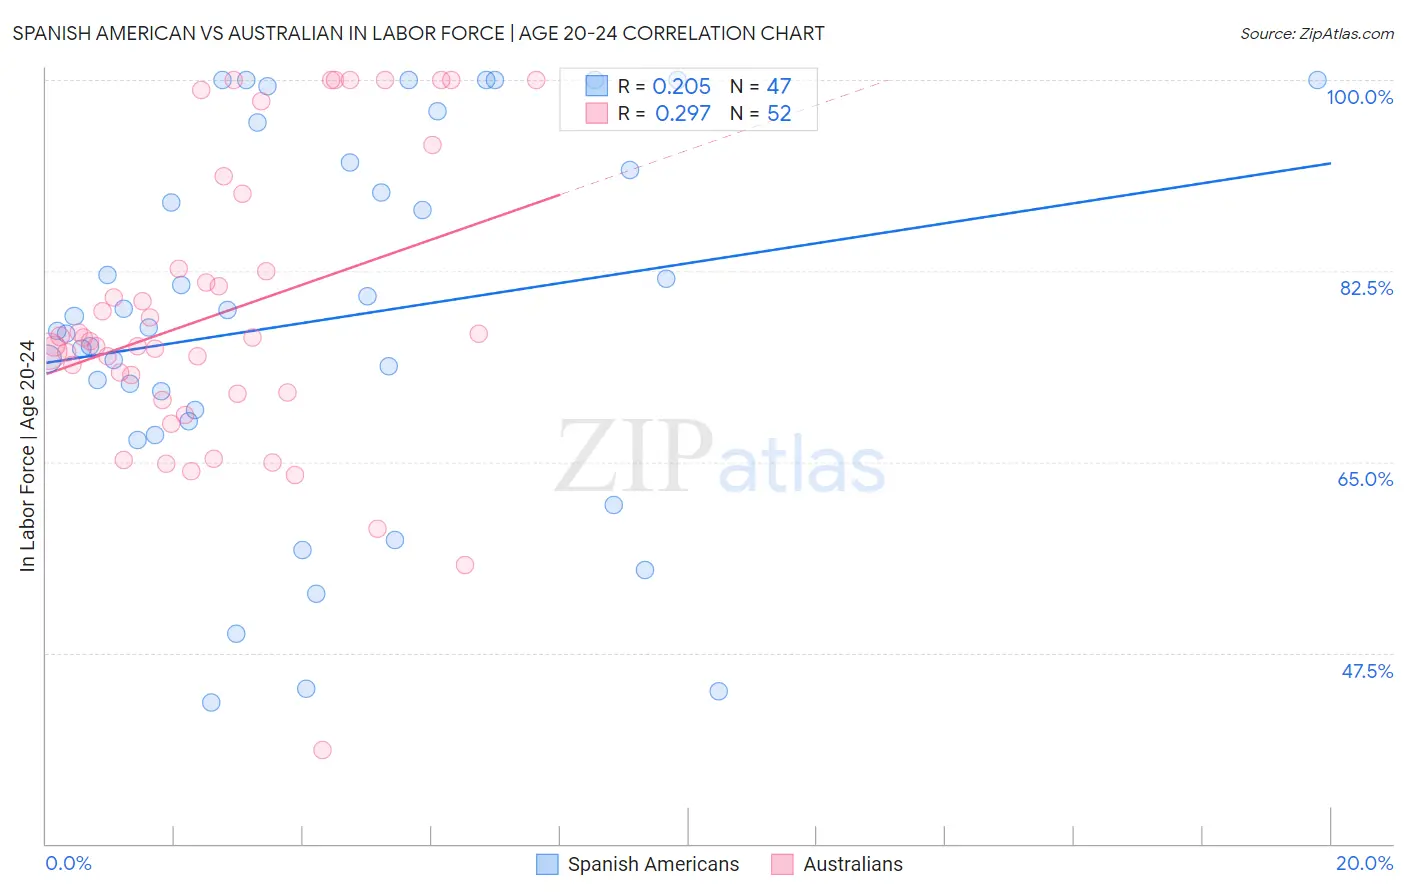
Spanish American vs Australian In Labor Force | Age 20-24 Correlation Chart
The statistical analysis conducted on geographies consisting of 103,134,697 people shows a weak positive correlation between the proportion of Spanish Americans and labor force participation rate among population between the ages 20 and 24 in the United States with a correlation coefficient (R) of 0.205 and weighted average of 75.8%. Similarly, the statistical analysis conducted on geographies consisting of 224,080,668 people shows a weak positive correlation between the proportion of Australians and labor force participation rate among population between the ages 20 and 24 in the United States with a correlation coefficient (R) of 0.297 and weighted average of 75.5%, a difference of 0.43%.
In Labor Force | Age 20-24 Correlation Summary
| Measurement | Spanish American | Australian |
| Minimum | 43.0% | 38.6% |
| Maximum | 100.0% | 100.0% |
| Range | 57.0% | 61.4% |
| Mean | 77.9% | 78.6% |
| Median | 77.3% | 76.2% |
| Interquartile 25% (IQ1) | 68.7% | 71.3% |
| Interquartile 75% (IQ3) | 92.4% | 86.1% |
| Interquartile Range (IQR) | 23.8% | 14.8% |
| Standard Deviation (Sample) | 16.8% | 13.5% |
| Standard Deviation (Population) | 16.6% | 13.3% |
Demographics Similar to Spanish Americans and Australians by In Labor Force | Age 20-24
In terms of in labor force | age 20-24, the demographic groups most similar to Spanish Americans are Immigrants from Portugal (75.8%, a difference of 0.0%), Immigrants from Africa (75.8%, a difference of 0.010%), Immigrants from Serbia (75.8%, a difference of 0.040%), Pakistani (75.8%, a difference of 0.050%), and Immigrants from Bulgaria (75.8%, a difference of 0.050%). Similarly, the demographic groups most similar to Australians are Immigrants from Brazil (75.5%, a difference of 0.0%), Jordanian (75.5%, a difference of 0.0%), Yaqui (75.5%, a difference of 0.020%), Estonian (75.6%, a difference of 0.070%), and Zimbabwean (75.6%, a difference of 0.11%).
| Demographics | Rating | Rank | In Labor Force | Age 20-24 |
| Spanish Americans | 94.8 /100 | #118 | Exceptional 75.8% |
| Immigrants | Portugal | 94.8 /100 | #119 | Exceptional 75.8% |
| Immigrants | Africa | 94.6 /100 | #120 | Exceptional 75.8% |
| Immigrants | Serbia | 94.3 /100 | #121 | Exceptional 75.8% |
| Pakistanis | 94.1 /100 | #122 | Exceptional 75.8% |
| Immigrants | Bulgaria | 94.1 /100 | #123 | Exceptional 75.8% |
| Immigrants | Sierra Leone | 93.8 /100 | #124 | Exceptional 75.8% |
| Immigrants | Scotland | 93.7 /100 | #125 | Exceptional 75.8% |
| Brazilians | 93.0 /100 | #126 | Exceptional 75.8% |
| Sub-Saharan Africans | 90.9 /100 | #127 | Exceptional 75.7% |
| Immigrants | Afghanistan | 89.4 /100 | #128 | Excellent 75.6% |
| Iroquois | 89.1 /100 | #129 | Excellent 75.6% |
| Immigrants | Austria | 88.8 /100 | #130 | Excellent 75.6% |
| Immigrants | Jordan | 88.5 /100 | #131 | Excellent 75.6% |
| Palestinians | 88.4 /100 | #132 | Excellent 75.6% |
| Zimbabweans | 88.2 /100 | #133 | Excellent 75.6% |
| Estonians | 87.1 /100 | #134 | Excellent 75.6% |
| Yaqui | 85.5 /100 | #135 | Excellent 75.5% |
| Immigrants | Brazil | 84.8 /100 | #136 | Excellent 75.5% |
| Jordanians | 84.8 /100 | #137 | Excellent 75.5% |
| Australians | 84.8 /100 | #138 | Excellent 75.5% |