Romanian vs Immigrants from Afghanistan In Labor Force | Age 25-29
COMPARE
Romanian
Immigrants from Afghanistan
In Labor Force | Age 25-29
In Labor Force | Age 25-29 Comparison
Romanians
Immigrants from Afghanistan
84.8%
IN LABOR FORCE | AGE 25-29
77.7/ 100
METRIC RATING
132nd/ 347
METRIC RANK
84.4%
IN LABOR FORCE | AGE 25-29
15.6/ 100
METRIC RATING
203rd/ 347
METRIC RANK
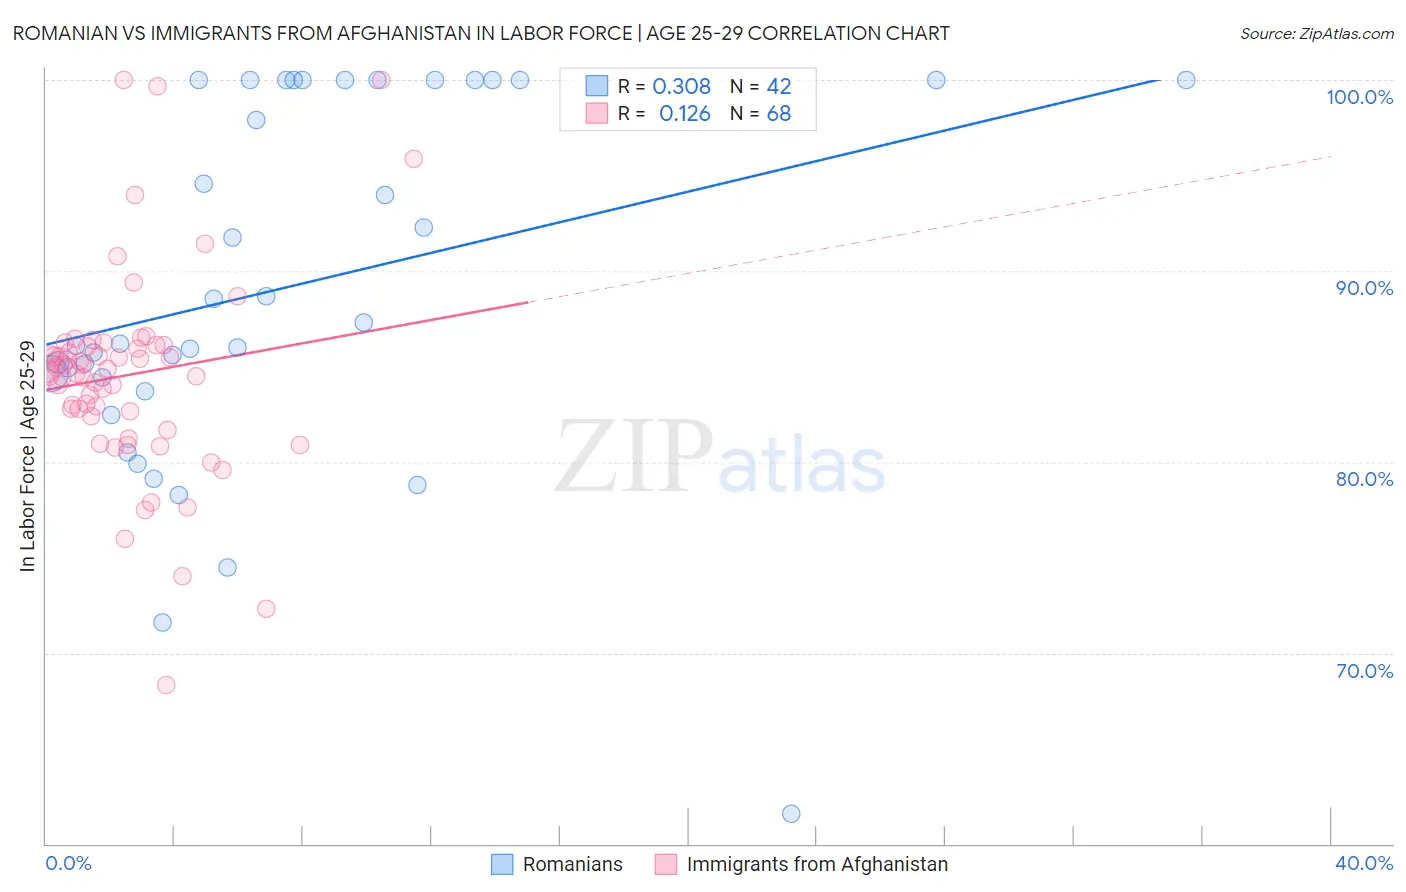
Romanian vs Immigrants from Afghanistan In Labor Force | Age 25-29 Correlation Chart
The statistical analysis conducted on geographies consisting of 377,759,265 people shows a mild positive correlation between the proportion of Romanians and labor force participation rate among population between the ages 25 and 29 in the United States with a correlation coefficient (R) of 0.308 and weighted average of 84.8%. Similarly, the statistical analysis conducted on geographies consisting of 147,629,697 people shows a poor positive correlation between the proportion of Immigrants from Afghanistan and labor force participation rate among population between the ages 25 and 29 in the United States with a correlation coefficient (R) of 0.126 and weighted average of 84.4%, a difference of 0.54%.
In Labor Force | Age 25-29 Correlation Summary
| Measurement | Romanian | Immigrants from Afghanistan |
| Minimum | 61.6% | 68.3% |
| Maximum | 100.0% | 100.0% |
| Range | 38.4% | 31.7% |
| Mean | 89.2% | 84.5% |
| Median | 86.7% | 84.8% |
| Interquartile 25% (IQ1) | 84.4% | 82.5% |
| Interquartile 75% (IQ3) | 100.0% | 86.1% |
| Interquartile Range (IQR) | 15.6% | 3.6% |
| Standard Deviation (Sample) | 9.5% | 5.5% |
| Standard Deviation (Population) | 9.4% | 5.4% |
Similar Demographics by In Labor Force | Age 25-29
Demographics Similar to Romanians by In Labor Force | Age 25-29
In terms of in labor force | age 25-29, the demographic groups most similar to Romanians are Iranian (84.8%, a difference of 0.0%), Asian (84.8%, a difference of 0.0%), Syrian (84.8%, a difference of 0.010%), Immigrants from Hungary (84.8%, a difference of 0.010%), and Bhutanese (84.8%, a difference of 0.020%).
| Demographics | Rating | Rank | In Labor Force | Age 25-29 |
| Uruguayans | 84.7 /100 | #125 | Excellent 84.9% |
| Immigrants | Singapore | 84.4 /100 | #126 | Excellent 84.9% |
| Immigrants | Uruguay | 84.0 /100 | #127 | Excellent 84.9% |
| Australians | 83.6 /100 | #128 | Excellent 84.9% |
| Immigrants | Russia | 81.6 /100 | #129 | Excellent 84.9% |
| Northern Europeans | 81.3 /100 | #130 | Excellent 84.9% |
| Iranians | 78.1 /100 | #131 | Good 84.8% |
| Romanians | 77.7 /100 | #132 | Good 84.8% |
| Asians | 77.7 /100 | #133 | Good 84.8% |
| Syrians | 76.5 /100 | #134 | Good 84.8% |
| Immigrants | Hungary | 76.4 /100 | #135 | Good 84.8% |
| Bhutanese | 76.0 /100 | #136 | Good 84.8% |
| Immigrants | Canada | 73.5 /100 | #137 | Good 84.8% |
| Armenians | 72.7 /100 | #138 | Good 84.8% |
| Immigrants | Eastern Asia | 72.6 /100 | #139 | Good 84.8% |
Demographics Similar to Immigrants from Afghanistan by In Labor Force | Age 25-29
In terms of in labor force | age 25-29, the demographic groups most similar to Immigrants from Afghanistan are Afghan (84.4%, a difference of 0.0%), Laotian (84.4%, a difference of 0.010%), Venezuelan (84.4%, a difference of 0.010%), Ecuadorian (84.4%, a difference of 0.010%), and Immigrants from Kazakhstan (84.4%, a difference of 0.020%).
| Demographics | Rating | Rank | In Labor Force | Age 25-29 |
| Immigrants | South Eastern Asia | 19.5 /100 | #196 | Poor 84.4% |
| Tlingit-Haida | 19.3 /100 | #197 | Poor 84.4% |
| Immigrants | Iraq | 19.0 /100 | #198 | Poor 84.4% |
| Immigrants | Germany | 18.3 /100 | #199 | Poor 84.4% |
| Immigrants | Kazakhstan | 17.5 /100 | #200 | Poor 84.4% |
| Laotians | 16.6 /100 | #201 | Poor 84.4% |
| Afghans | 15.9 /100 | #202 | Poor 84.4% |
| Immigrants | Afghanistan | 15.6 /100 | #203 | Poor 84.4% |
| Venezuelans | 15.1 /100 | #204 | Poor 84.4% |
| Ecuadorians | 14.8 /100 | #205 | Poor 84.4% |
| Immigrants | Cambodia | 14.3 /100 | #206 | Poor 84.4% |
| Immigrants | Armenia | 13.3 /100 | #207 | Poor 84.4% |
| Immigrants | Indonesia | 13.2 /100 | #208 | Poor 84.4% |
| Immigrants | Jordan | 12.8 /100 | #209 | Poor 84.4% |
| Chinese | 12.7 /100 | #210 | Poor 84.3% |