Nepalese vs Crow In Labor Force | Age > 16
COMPARE
Nepalese
Crow
In Labor Force | Age > 16
In Labor Force | Age > 16 Comparison
Nepalese
Crow
63.8%
IN LABOR FORCE | AGE > 16
0.1/ 100
METRIC RATING
291st/ 347
METRIC RANK
60.8%
IN LABOR FORCE | AGE > 16
0.0/ 100
METRIC RATING
332nd/ 347
METRIC RANK
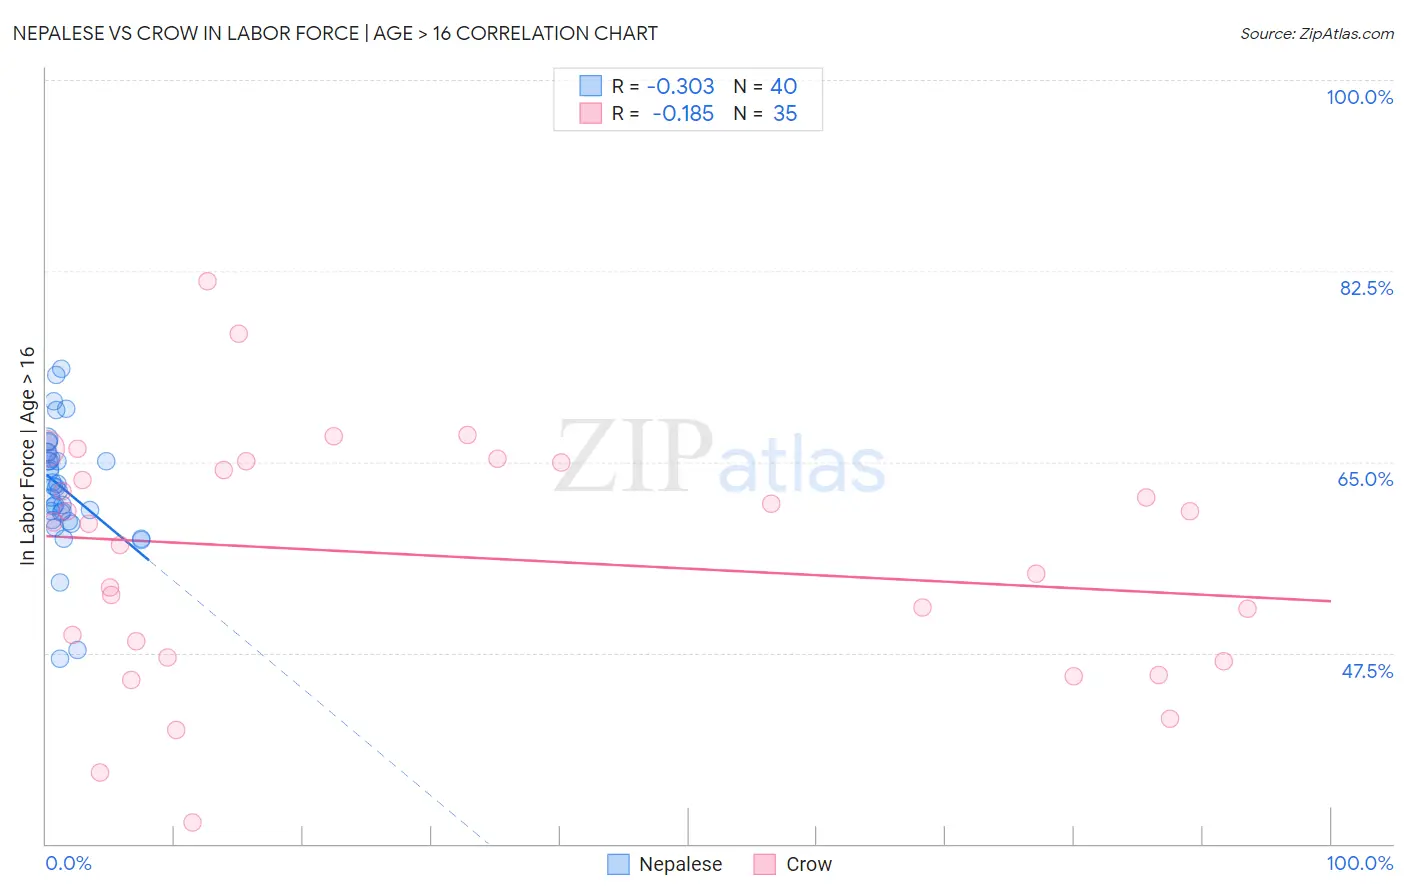
Nepalese vs Crow In Labor Force | Age > 16 Correlation Chart
The statistical analysis conducted on geographies consisting of 24,521,755 people shows a mild negative correlation between the proportion of Nepalese and labor force participation rate among population ages 16 and over in the United States with a correlation coefficient (R) of -0.303 and weighted average of 63.8%. Similarly, the statistical analysis conducted on geographies consisting of 59,204,758 people shows a poor negative correlation between the proportion of Crow and labor force participation rate among population ages 16 and over in the United States with a correlation coefficient (R) of -0.185 and weighted average of 60.8%, a difference of 5.0%.
In Labor Force | Age > 16 Correlation Summary
| Measurement | Nepalese | Crow |
| Minimum | 47.0% | 31.9% |
| Maximum | 73.5% | 81.6% |
| Range | 26.5% | 49.7% |
| Mean | 62.6% | 56.4% |
| Median | 62.7% | 59.4% |
| Interquartile 25% (IQ1) | 60.0% | 47.1% |
| Interquartile 75% (IQ3) | 65.6% | 65.0% |
| Interquartile Range (IQR) | 5.5% | 17.9% |
| Standard Deviation (Sample) | 5.5% | 11.1% |
| Standard Deviation (Population) | 5.4% | 10.9% |
Similar Demographics by In Labor Force | Age > 16
Demographics Similar to Nepalese by In Labor Force | Age > 16
In terms of in labor force | age > 16, the demographic groups most similar to Nepalese are Hungarian (63.8%, a difference of 0.010%), Celtic (63.8%, a difference of 0.040%), Spanish American Indian (63.8%, a difference of 0.060%), Spanish (63.9%, a difference of 0.070%), and English (63.7%, a difference of 0.10%).
| Demographics | Rating | Rank | In Labor Force | Age > 16 |
| French | 0.1 /100 | #284 | Tragic 63.9% |
| Slovaks | 0.1 /100 | #285 | Tragic 63.9% |
| Immigrants | Austria | 0.1 /100 | #286 | Tragic 63.9% |
| Scottish | 0.1 /100 | #287 | Tragic 63.9% |
| Spanish | 0.1 /100 | #288 | Tragic 63.9% |
| Celtics | 0.1 /100 | #289 | Tragic 63.8% |
| Hungarians | 0.1 /100 | #290 | Tragic 63.8% |
| Nepalese | 0.1 /100 | #291 | Tragic 63.8% |
| Spanish American Indians | 0.1 /100 | #292 | Tragic 63.8% |
| English | 0.1 /100 | #293 | Tragic 63.7% |
| Puget Sound Salish | 0.0 /100 | #294 | Tragic 63.7% |
| Immigrants | Canada | 0.0 /100 | #295 | Tragic 63.7% |
| Immigrants | North America | 0.0 /100 | #296 | Tragic 63.7% |
| Immigrants | Grenada | 0.0 /100 | #297 | Tragic 63.6% |
| Comanche | 0.0 /100 | #298 | Tragic 63.6% |
Demographics Similar to Crow by In Labor Force | Age > 16
In terms of in labor force | age > 16, the demographic groups most similar to Crow are Paiute (60.7%, a difference of 0.080%), Apache (60.7%, a difference of 0.13%), Ute (60.9%, a difference of 0.17%), Native/Alaskan (60.6%, a difference of 0.31%), and Menominee (60.6%, a difference of 0.34%).
| Demographics | Rating | Rank | In Labor Force | Age > 16 |
| Cherokee | 0.0 /100 | #325 | Tragic 61.9% |
| Sioux | 0.0 /100 | #326 | Tragic 61.8% |
| Cajuns | 0.0 /100 | #327 | Tragic 61.8% |
| Dutch West Indians | 0.0 /100 | #328 | Tragic 61.7% |
| Choctaw | 0.0 /100 | #329 | Tragic 61.5% |
| Creek | 0.0 /100 | #330 | Tragic 61.3% |
| Ute | 0.0 /100 | #331 | Tragic 60.9% |
| Crow | 0.0 /100 | #332 | Tragic 60.8% |
| Paiute | 0.0 /100 | #333 | Tragic 60.7% |
| Apache | 0.0 /100 | #334 | Tragic 60.7% |
| Natives/Alaskans | 0.0 /100 | #335 | Tragic 60.6% |
| Menominee | 0.0 /100 | #336 | Tragic 60.6% |
| Colville | 0.0 /100 | #337 | Tragic 59.8% |
| Immigrants | Yemen | 0.0 /100 | #338 | Tragic 59.6% |
| Houma | 0.0 /100 | #339 | Tragic 59.5% |