Lebanese vs Serbian In Labor Force | Age 45-54
COMPARE
Lebanese
Serbian
In Labor Force | Age 45-54
In Labor Force | Age 45-54 Comparison
Lebanese
Serbians
82.5%
IN LABOR FORCE | AGE 45-54
18.2/ 100
METRIC RATING
197th/ 347
METRIC RANK
83.4%
IN LABOR FORCE | AGE 45-54
97.2/ 100
METRIC RATING
72nd/ 347
METRIC RANK
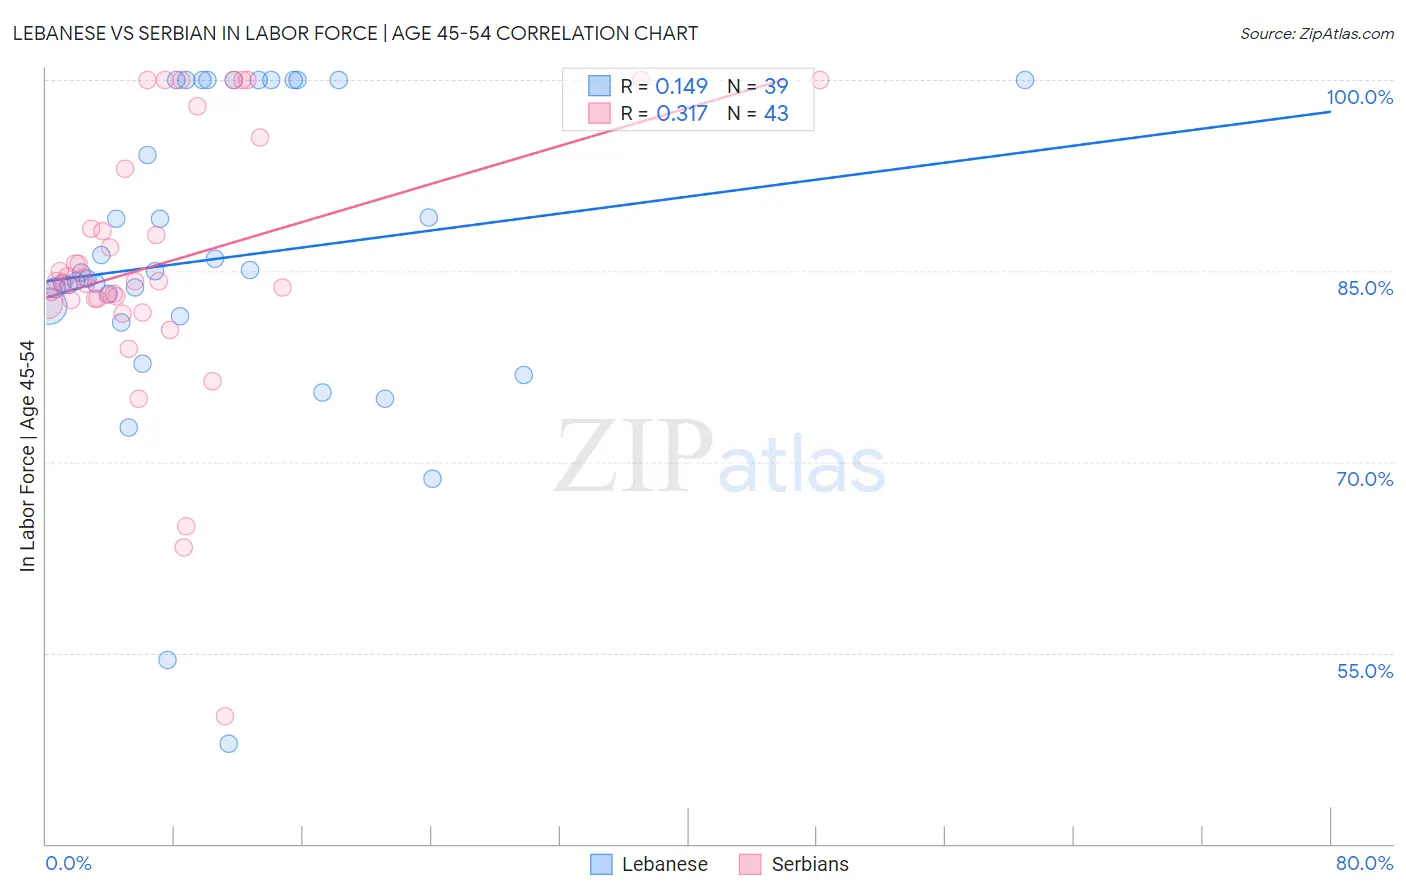
Lebanese vs Serbian In Labor Force | Age 45-54 Correlation Chart
The statistical analysis conducted on geographies consisting of 401,315,203 people shows a poor positive correlation between the proportion of Lebanese and labor force participation rate among population between the ages 45 and 54 in the United States with a correlation coefficient (R) of 0.149 and weighted average of 82.5%. Similarly, the statistical analysis conducted on geographies consisting of 267,517,171 people shows a mild positive correlation between the proportion of Serbians and labor force participation rate among population between the ages 45 and 54 in the United States with a correlation coefficient (R) of 0.317 and weighted average of 83.4%, a difference of 1.1%.
In Labor Force | Age 45-54 Correlation Summary
| Measurement | Lebanese | Serbian |
| Minimum | 47.9% | 50.0% |
| Maximum | 100.0% | 100.0% |
| Range | 52.1% | 50.0% |
| Mean | 86.0% | 85.6% |
| Median | 84.9% | 84.2% |
| Interquartile 25% (IQ1) | 81.5% | 82.7% |
| Interquartile 75% (IQ3) | 100.0% | 93.0% |
| Interquartile Range (IQR) | 18.5% | 10.3% |
| Standard Deviation (Sample) | 12.2% | 10.4% |
| Standard Deviation (Population) | 12.0% | 10.3% |
Similar Demographics by In Labor Force | Age 45-54
Demographics Similar to Lebanese by In Labor Force | Age 45-54
In terms of in labor force | age 45-54, the demographic groups most similar to Lebanese are Immigrants from North America (82.5%, a difference of 0.010%), Immigrants from Denmark (82.5%, a difference of 0.010%), Immigrants from Norway (82.5%, a difference of 0.030%), Immigrants from Canada (82.5%, a difference of 0.030%), and Immigrants from Iraq (82.5%, a difference of 0.040%).
| Demographics | Rating | Rank | In Labor Force | Age 45-54 |
| British | 25.7 /100 | #190 | Fair 82.6% |
| Armenians | 23.2 /100 | #191 | Fair 82.5% |
| Immigrants | Iraq | 20.9 /100 | #192 | Fair 82.5% |
| Australians | 20.8 /100 | #193 | Fair 82.5% |
| Immigrants | Norway | 20.7 /100 | #194 | Fair 82.5% |
| Immigrants | Canada | 20.0 /100 | #195 | Fair 82.5% |
| Immigrants | North America | 18.8 /100 | #196 | Poor 82.5% |
| Lebanese | 18.2 /100 | #197 | Poor 82.5% |
| Immigrants | Denmark | 17.9 /100 | #198 | Poor 82.5% |
| Moroccans | 15.7 /100 | #199 | Poor 82.5% |
| French Canadians | 15.4 /100 | #200 | Poor 82.5% |
| Canadians | 15.1 /100 | #201 | Poor 82.4% |
| Immigrants | Western Asia | 14.9 /100 | #202 | Poor 82.4% |
| Arabs | 11.6 /100 | #203 | Poor 82.4% |
| Immigrants | Western Europe | 10.9 /100 | #204 | Poor 82.4% |
Demographics Similar to Serbians by In Labor Force | Age 45-54
In terms of in labor force | age 45-54, the demographic groups most similar to Serbians are Immigrants from Czechoslovakia (83.4%, a difference of 0.010%), Immigrants from Latvia (83.4%, a difference of 0.020%), Colombian (83.4%, a difference of 0.020%), Immigrants from Somalia (83.4%, a difference of 0.020%), and Estonian (83.4%, a difference of 0.020%).
| Demographics | Rating | Rank | In Labor Force | Age 45-54 |
| Egyptians | 97.9 /100 | #65 | Exceptional 83.5% |
| Asians | 97.7 /100 | #66 | Exceptional 83.4% |
| Chileans | 97.7 /100 | #67 | Exceptional 83.4% |
| Immigrants | Colombia | 97.6 /100 | #68 | Exceptional 83.4% |
| Taiwanese | 97.5 /100 | #69 | Exceptional 83.4% |
| Immigrants | Latvia | 97.4 /100 | #70 | Exceptional 83.4% |
| Colombians | 97.3 /100 | #71 | Exceptional 83.4% |
| Serbians | 97.2 /100 | #72 | Exceptional 83.4% |
| Immigrants | Czechoslovakia | 97.1 /100 | #73 | Exceptional 83.4% |
| Immigrants | Somalia | 96.9 /100 | #74 | Exceptional 83.4% |
| Estonians | 96.9 /100 | #75 | Exceptional 83.4% |
| Russians | 96.8 /100 | #76 | Exceptional 83.4% |
| Cubans | 96.7 /100 | #77 | Exceptional 83.4% |
| Immigrants | Egypt | 96.6 /100 | #78 | Exceptional 83.4% |
| Belgians | 96.5 /100 | #79 | Exceptional 83.4% |