Israeli vs Dominican In Labor Force | Age 20-24
COMPARE
Israeli
Dominican
In Labor Force | Age 20-24
In Labor Force | Age 20-24 Comparison
Israelis
Dominicans
72.6%
IN LABOR FORCE | AGE 20-24
0.0/ 100
METRIC RATING
298th/ 347
METRIC RANK
71.1%
IN LABOR FORCE | AGE 20-24
0.0/ 100
METRIC RATING
326th/ 347
METRIC RANK
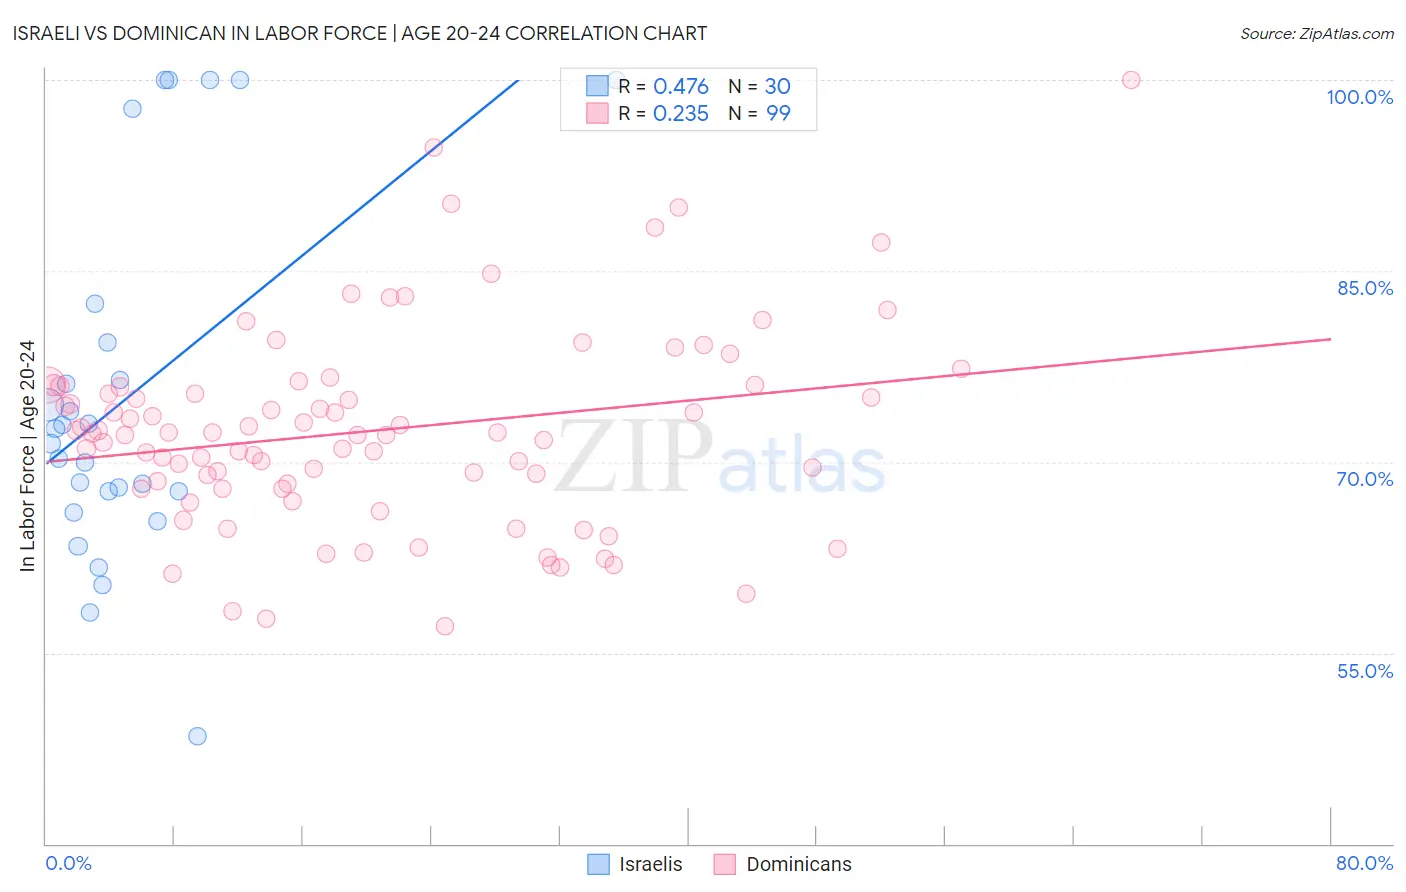
Israeli vs Dominican In Labor Force | Age 20-24 Correlation Chart
The statistical analysis conducted on geographies consisting of 211,140,370 people shows a moderate positive correlation between the proportion of Israelis and labor force participation rate among population between the ages 20 and 24 in the United States with a correlation coefficient (R) of 0.476 and weighted average of 72.6%. Similarly, the statistical analysis conducted on geographies consisting of 355,092,394 people shows a weak positive correlation between the proportion of Dominicans and labor force participation rate among population between the ages 20 and 24 in the United States with a correlation coefficient (R) of 0.235 and weighted average of 71.1%, a difference of 2.1%.
In Labor Force | Age 20-24 Correlation Summary
| Measurement | Israeli | Dominican |
| Minimum | 48.4% | 57.1% |
| Maximum | 100.0% | 100.0% |
| Range | 51.6% | 42.9% |
| Mean | 75.1% | 72.4% |
| Median | 72.0% | 72.2% |
| Interquartile 25% (IQ1) | 67.7% | 67.9% |
| Interquartile 75% (IQ3) | 79.4% | 76.0% |
| Interquartile Range (IQR) | 11.7% | 8.1% |
| Standard Deviation (Sample) | 14.1% | 7.8% |
| Standard Deviation (Population) | 13.8% | 7.7% |
Similar Demographics by In Labor Force | Age 20-24
Demographics Similar to Israelis by In Labor Force | Age 20-24
In terms of in labor force | age 20-24, the demographic groups most similar to Israelis are Iranian (72.6%, a difference of 0.040%), Armenian (72.5%, a difference of 0.070%), Central American Indian (72.7%, a difference of 0.13%), Cuban (72.5%, a difference of 0.14%), and Jamaican (72.7%, a difference of 0.17%).
| Demographics | Rating | Rank | In Labor Force | Age 20-24 |
| Immigrants | Nicaragua | 0.0 /100 | #291 | Tragic 72.9% |
| Pueblo | 0.0 /100 | #292 | Tragic 72.9% |
| Immigrants | Belize | 0.0 /100 | #293 | Tragic 72.8% |
| Immigrants | Argentina | 0.0 /100 | #294 | Tragic 72.8% |
| Okinawans | 0.0 /100 | #295 | Tragic 72.7% |
| Jamaicans | 0.0 /100 | #296 | Tragic 72.7% |
| Central American Indians | 0.0 /100 | #297 | Tragic 72.7% |
| Israelis | 0.0 /100 | #298 | Tragic 72.6% |
| Iranians | 0.0 /100 | #299 | Tragic 72.6% |
| Armenians | 0.0 /100 | #300 | Tragic 72.5% |
| Cubans | 0.0 /100 | #301 | Tragic 72.5% |
| Natives/Alaskans | 0.0 /100 | #302 | Tragic 72.4% |
| Ecuadorians | 0.0 /100 | #303 | Tragic 72.4% |
| Immigrants | West Indies | 0.0 /100 | #304 | Tragic 72.4% |
| Immigrants | Singapore | 0.0 /100 | #305 | Tragic 72.4% |
Demographics Similar to Dominicans by In Labor Force | Age 20-24
In terms of in labor force | age 20-24, the demographic groups most similar to Dominicans are Immigrants from Trinidad and Tobago (71.1%, a difference of 0.0%), Immigrants from China (71.1%, a difference of 0.020%), Barbadian (71.1%, a difference of 0.080%), Immigrants from Dominican Republic (71.2%, a difference of 0.19%), and Yup'ik (70.9%, a difference of 0.26%).
| Demographics | Rating | Rank | In Labor Force | Age 20-24 |
| Immigrants | Israel | 0.0 /100 | #319 | Tragic 71.6% |
| Trinidadians and Tobagonians | 0.0 /100 | #320 | Tragic 71.5% |
| Immigrants | Taiwan | 0.0 /100 | #321 | Tragic 71.5% |
| Filipinos | 0.0 /100 | #322 | Tragic 71.4% |
| West Indians | 0.0 /100 | #323 | Tragic 71.3% |
| Immigrants | Dominican Republic | 0.0 /100 | #324 | Tragic 71.2% |
| Barbadians | 0.0 /100 | #325 | Tragic 71.1% |
| Dominicans | 0.0 /100 | #326 | Tragic 71.1% |
| Immigrants | Trinidad and Tobago | 0.0 /100 | #327 | Tragic 71.1% |
| Immigrants | China | 0.0 /100 | #328 | Tragic 71.1% |
| Yup'ik | 0.0 /100 | #329 | Tragic 70.9% |
| Vietnamese | 0.0 /100 | #330 | Tragic 70.6% |
| Immigrants | Bangladesh | 0.0 /100 | #331 | Tragic 70.6% |
| Immigrants | Uzbekistan | 0.0 /100 | #332 | Tragic 70.4% |
| Yuman | 0.0 /100 | #333 | Tragic 70.3% |