Immigrants vs Immigrants from Peru In Labor Force | Age 25-29
COMPARE
Immigrants
Immigrants from Peru
In Labor Force | Age 25-29
In Labor Force | Age 25-29 Comparison
Immigrants
Immigrants from Peru
83.9%
IN LABOR FORCE | AGE 25-29
0.9/ 100
METRIC RATING
237th/ 347
METRIC RANK
84.7%
IN LABOR FORCE | AGE 25-29
58.6/ 100
METRIC RATING
160th/ 347
METRIC RANK
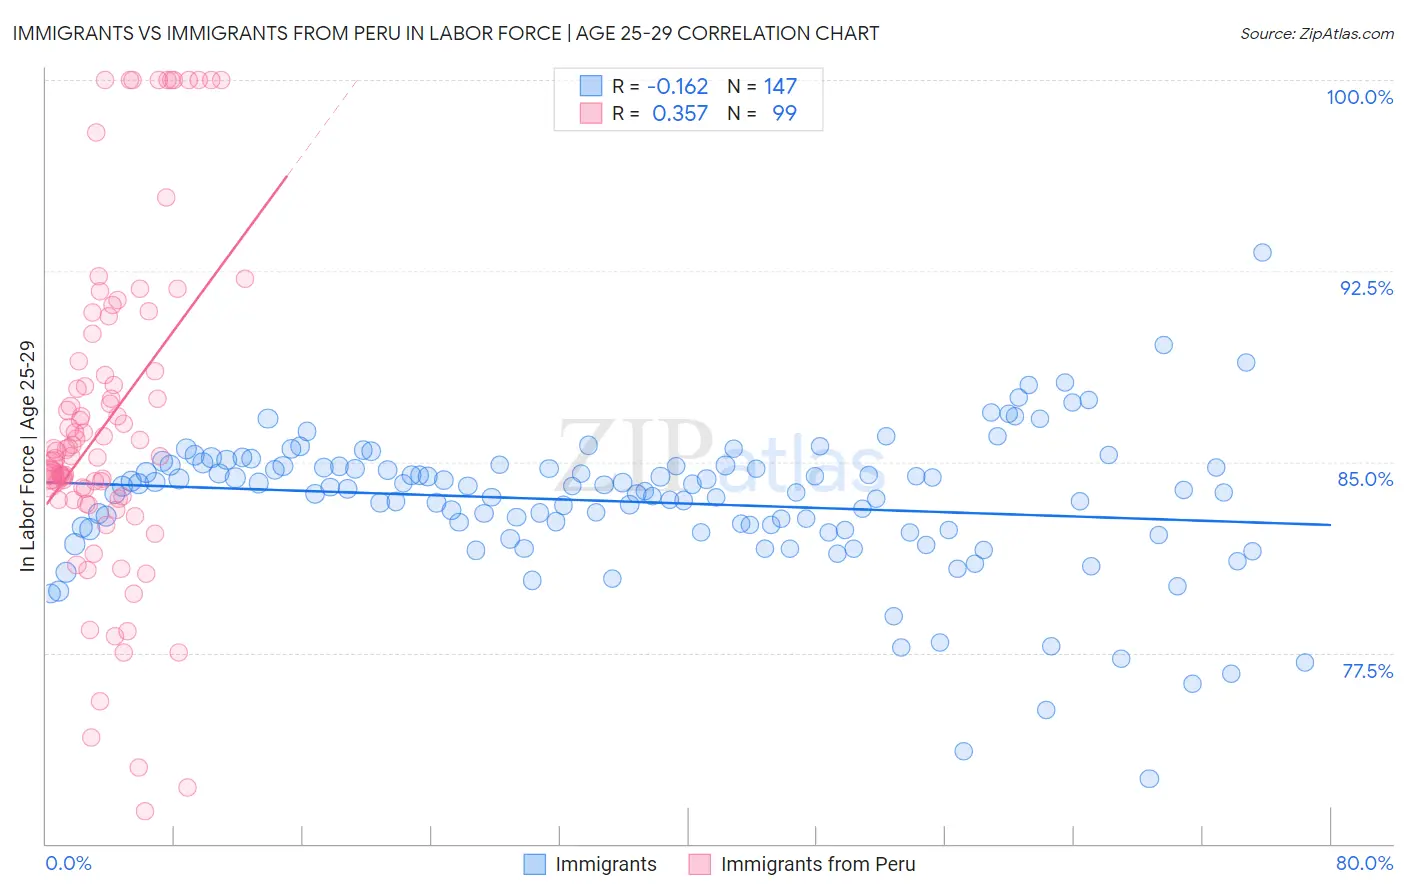
Immigrants vs Immigrants from Peru In Labor Force | Age 25-29 Correlation Chart
The statistical analysis conducted on geographies consisting of 576,264,876 people shows a poor negative correlation between the proportion of Immigrants and labor force participation rate among population between the ages 25 and 29 in the United States with a correlation coefficient (R) of -0.162 and weighted average of 83.9%. Similarly, the statistical analysis conducted on geographies consisting of 328,804,667 people shows a mild positive correlation between the proportion of Immigrants from Peru and labor force participation rate among population between the ages 25 and 29 in the United States with a correlation coefficient (R) of 0.357 and weighted average of 84.7%, a difference of 0.94%.
In Labor Force | Age 25-29 Correlation Summary
| Measurement | Immigrants | Immigrants from Peru |
| Minimum | 72.6% | 71.3% |
| Maximum | 93.2% | 100.0% |
| Range | 20.6% | 28.7% |
| Mean | 83.4% | 86.6% |
| Median | 83.9% | 85.4% |
| Interquartile 25% (IQ1) | 82.3% | 83.5% |
| Interquartile 75% (IQ3) | 84.8% | 88.9% |
| Interquartile Range (IQR) | 2.5% | 5.4% |
| Standard Deviation (Sample) | 2.8% | 6.5% |
| Standard Deviation (Population) | 2.8% | 6.5% |
Similar Demographics by In Labor Force | Age 25-29
Demographics Similar to Immigrants by In Labor Force | Age 25-29
In terms of in labor force | age 25-29, the demographic groups most similar to Immigrants are Guamanian/Chamorro (83.9%, a difference of 0.0%), Iraqi (83.9%, a difference of 0.010%), Barbadian (83.9%, a difference of 0.030%), Immigrants from Uzbekistan (83.9%, a difference of 0.030%), and Jamaican (83.9%, a difference of 0.030%).
| Demographics | Rating | Rank | In Labor Force | Age 25-29 |
| Whites/Caucasians | 4.8 /100 | #230 | Tragic 84.2% |
| Immigrants | Philippines | 4.7 /100 | #231 | Tragic 84.2% |
| Panamanians | 4.5 /100 | #232 | Tragic 84.2% |
| Immigrants | Western Asia | 2.7 /100 | #233 | Tragic 84.1% |
| Barbadians | 1.0 /100 | #234 | Tragic 83.9% |
| Iraqis | 0.9 /100 | #235 | Tragic 83.9% |
| Guamanians/Chamorros | 0.9 /100 | #236 | Tragic 83.9% |
| Immigrants | Immigrants | 0.9 /100 | #237 | Tragic 83.9% |
| Immigrants | Uzbekistan | 0.8 /100 | #238 | Tragic 83.9% |
| Jamaicans | 0.8 /100 | #239 | Tragic 83.9% |
| Trinidadians and Tobagonians | 0.7 /100 | #240 | Tragic 83.9% |
| Alsatians | 0.7 /100 | #241 | Tragic 83.9% |
| U.S. Virgin Islanders | 0.6 /100 | #242 | Tragic 83.8% |
| Salvadorans | 0.5 /100 | #243 | Tragic 83.8% |
| Immigrants | Jamaica | 0.4 /100 | #244 | Tragic 83.8% |
Demographics Similar to Immigrants from Peru by In Labor Force | Age 25-29
In terms of in labor force | age 25-29, the demographic groups most similar to Immigrants from Peru are Canadian (84.7%, a difference of 0.0%), Immigrants from Colombia (84.7%, a difference of 0.0%), British (84.7%, a difference of 0.010%), Immigrants from Ghana (84.7%, a difference of 0.010%), and Immigrants from Western Africa (84.7%, a difference of 0.010%).
| Demographics | Rating | Rank | In Labor Force | Age 25-29 |
| Immigrants | Taiwan | 62.2 /100 | #153 | Good 84.7% |
| Immigrants | Sri Lanka | 61.7 /100 | #154 | Good 84.7% |
| Indians (Asian) | 61.6 /100 | #155 | Good 84.7% |
| French | 61.0 /100 | #156 | Good 84.7% |
| British | 60.4 /100 | #157 | Good 84.7% |
| Immigrants | Ghana | 60.2 /100 | #158 | Good 84.7% |
| Immigrants | Western Africa | 60.1 /100 | #159 | Good 84.7% |
| Immigrants | Peru | 58.6 /100 | #160 | Average 84.7% |
| Canadians | 58.5 /100 | #161 | Average 84.7% |
| Immigrants | Colombia | 58.3 /100 | #162 | Average 84.7% |
| Argentineans | 57.9 /100 | #163 | Average 84.7% |
| Ghanaians | 57.6 /100 | #164 | Average 84.7% |
| Immigrants | Burma/Myanmar | 57.4 /100 | #165 | Average 84.7% |
| Immigrants | Spain | 56.9 /100 | #166 | Average 84.7% |
| Indonesians | 56.5 /100 | #167 | Average 84.7% |