Immigrants vs Immigrants from Morocco In Labor Force | Age 45-54
COMPARE
Immigrants
Immigrants from Morocco
In Labor Force | Age 45-54
In Labor Force | Age 45-54 Comparison
Immigrants
Immigrants from Morocco
82.1%
IN LABOR FORCE | AGE 45-54
3.1/ 100
METRIC RATING
223rd/ 347
METRIC RANK
83.6%
IN LABOR FORCE | AGE 45-54
99.0/ 100
METRIC RATING
49th/ 347
METRIC RANK
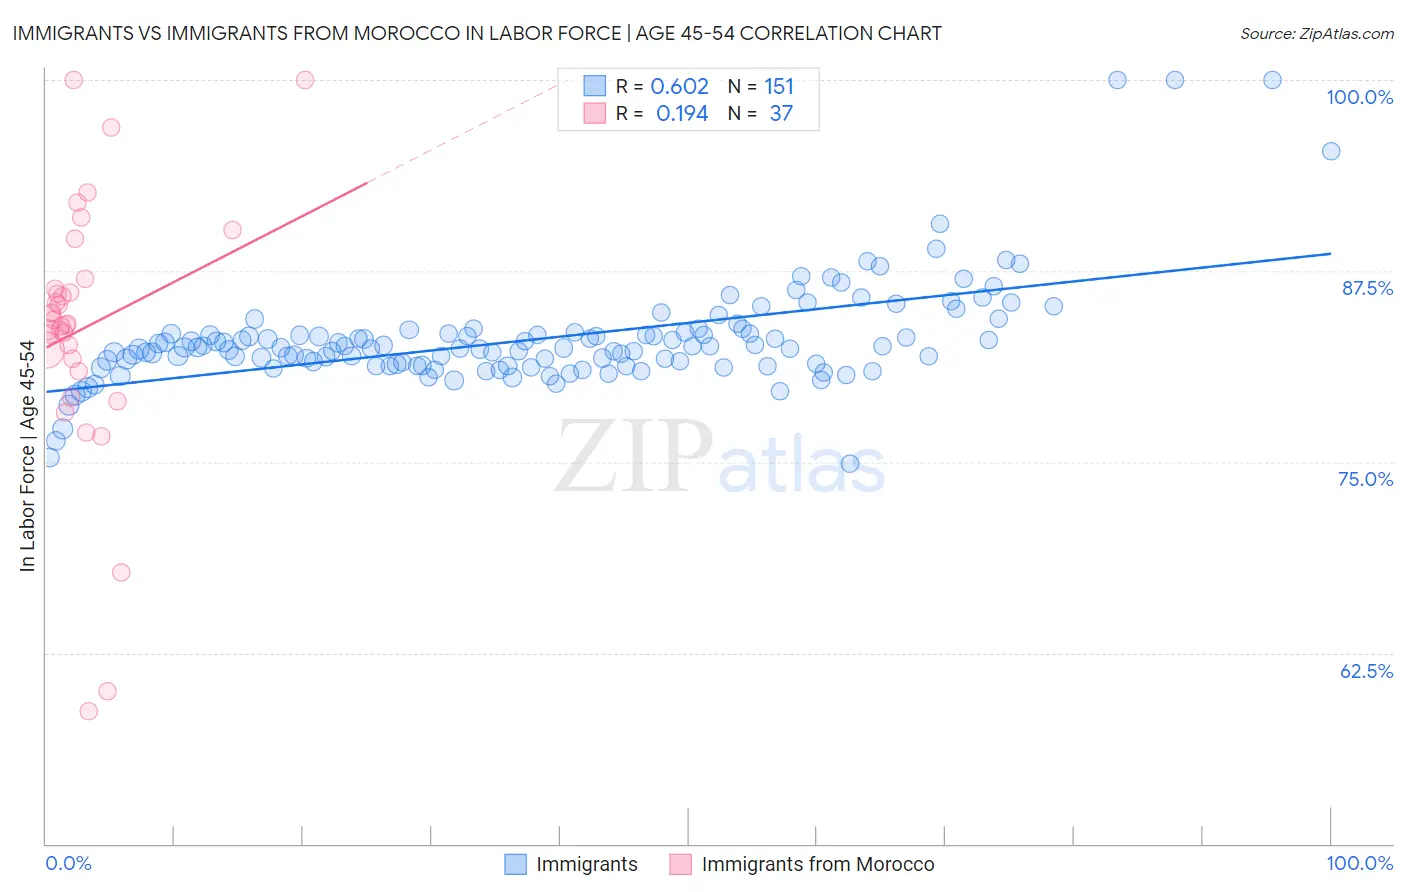
Immigrants vs Immigrants from Morocco In Labor Force | Age 45-54 Correlation Chart
The statistical analysis conducted on geographies consisting of 576,883,535 people shows a significant positive correlation between the proportion of Immigrants and labor force participation rate among population between the ages 45 and 54 in the United States with a correlation coefficient (R) of 0.602 and weighted average of 82.1%. Similarly, the statistical analysis conducted on geographies consisting of 178,909,930 people shows a poor positive correlation between the proportion of Immigrants from Morocco and labor force participation rate among population between the ages 45 and 54 in the United States with a correlation coefficient (R) of 0.194 and weighted average of 83.6%, a difference of 1.8%.
In Labor Force | Age 45-54 Correlation Summary
| Measurement | Immigrants | Immigrants from Morocco |
| Minimum | 74.9% | 58.7% |
| Maximum | 100.0% | 100.0% |
| Range | 25.1% | 41.3% |
| Mean | 83.1% | 83.7% |
| Median | 82.5% | 84.0% |
| Interquartile 25% (IQ1) | 81.3% | 81.3% |
| Interquartile 75% (IQ3) | 83.4% | 86.7% |
| Interquartile Range (IQR) | 2.1% | 5.4% |
| Standard Deviation (Sample) | 3.5% | 8.6% |
| Standard Deviation (Population) | 3.5% | 8.5% |
Similar Demographics by In Labor Force | Age 45-54
Demographics Similar to Immigrants by In Labor Force | Age 45-54
In terms of in labor force | age 45-54, the demographic groups most similar to Immigrants are Panamanian (82.2%, a difference of 0.020%), Immigrants from Ecuador (82.2%, a difference of 0.020%), Bahamian (82.2%, a difference of 0.030%), Immigrants from Jamaica (82.1%, a difference of 0.030%), and Immigrants from Oceania (82.1%, a difference of 0.050%).
| Demographics | Rating | Rank | In Labor Force | Age 45-54 |
| Scottish | 5.3 /100 | #216 | Tragic 82.2% |
| Portuguese | 4.7 /100 | #217 | Tragic 82.2% |
| English | 4.4 /100 | #218 | Tragic 82.2% |
| French | 4.1 /100 | #219 | Tragic 82.2% |
| Bahamians | 3.6 /100 | #220 | Tragic 82.2% |
| Panamanians | 3.5 /100 | #221 | Tragic 82.2% |
| Immigrants | Ecuador | 3.4 /100 | #222 | Tragic 82.2% |
| Immigrants | Immigrants | 3.1 /100 | #223 | Tragic 82.1% |
| Immigrants | Jamaica | 2.7 /100 | #224 | Tragic 82.1% |
| Immigrants | Oceania | 2.5 /100 | #225 | Tragic 82.1% |
| Immigrants | Caribbean | 2.5 /100 | #226 | Tragic 82.1% |
| Immigrants | Germany | 2.4 /100 | #227 | Tragic 82.1% |
| Cape Verdeans | 2.1 /100 | #228 | Tragic 82.1% |
| Immigrants | Burma/Myanmar | 1.9 /100 | #229 | Tragic 82.0% |
| Jamaicans | 1.8 /100 | #230 | Tragic 82.0% |
Demographics Similar to Immigrants from Morocco by In Labor Force | Age 45-54
In terms of in labor force | age 45-54, the demographic groups most similar to Immigrants from Morocco are Immigrants from Poland (83.6%, a difference of 0.0%), Croatian (83.6%, a difference of 0.010%), Lithuanian (83.6%, a difference of 0.020%), Burmese (83.6%, a difference of 0.030%), and Immigrants from Hong Kong (83.6%, a difference of 0.030%).
| Demographics | Rating | Rank | In Labor Force | Age 45-54 |
| Immigrants | Moldova | 99.3 /100 | #42 | Exceptional 83.7% |
| Venezuelans | 99.2 /100 | #43 | Exceptional 83.6% |
| Burmese | 99.1 /100 | #44 | Exceptional 83.6% |
| Immigrants | Hong Kong | 99.1 /100 | #45 | Exceptional 83.6% |
| Lithuanians | 99.1 /100 | #46 | Exceptional 83.6% |
| Croatians | 99.0 /100 | #47 | Exceptional 83.6% |
| Immigrants | Poland | 99.0 /100 | #48 | Exceptional 83.6% |
| Immigrants | Morocco | 99.0 /100 | #49 | Exceptional 83.6% |
| Immigrants | Greece | 98.8 /100 | #50 | Exceptional 83.6% |
| Immigrants | Turkey | 98.8 /100 | #51 | Exceptional 83.6% |
| Poles | 98.7 /100 | #52 | Exceptional 83.6% |
| Peruvians | 98.7 /100 | #53 | Exceptional 83.6% |
| Somalis | 98.7 /100 | #54 | Exceptional 83.5% |
| Macedonians | 98.7 /100 | #55 | Exceptional 83.5% |
| Immigrants | Peru | 98.6 /100 | #56 | Exceptional 83.5% |