Immigrants vs Greek In Labor Force | Age 35-44
COMPARE
Immigrants
Greek
In Labor Force | Age 35-44
In Labor Force | Age 35-44 Comparison
Immigrants
Greeks
83.7%
IN LABOR FORCE | AGE 35-44
1.0/ 100
METRIC RATING
246th/ 347
METRIC RANK
84.9%
IN LABOR FORCE | AGE 35-44
97.8/ 100
METRIC RATING
86th/ 347
METRIC RANK
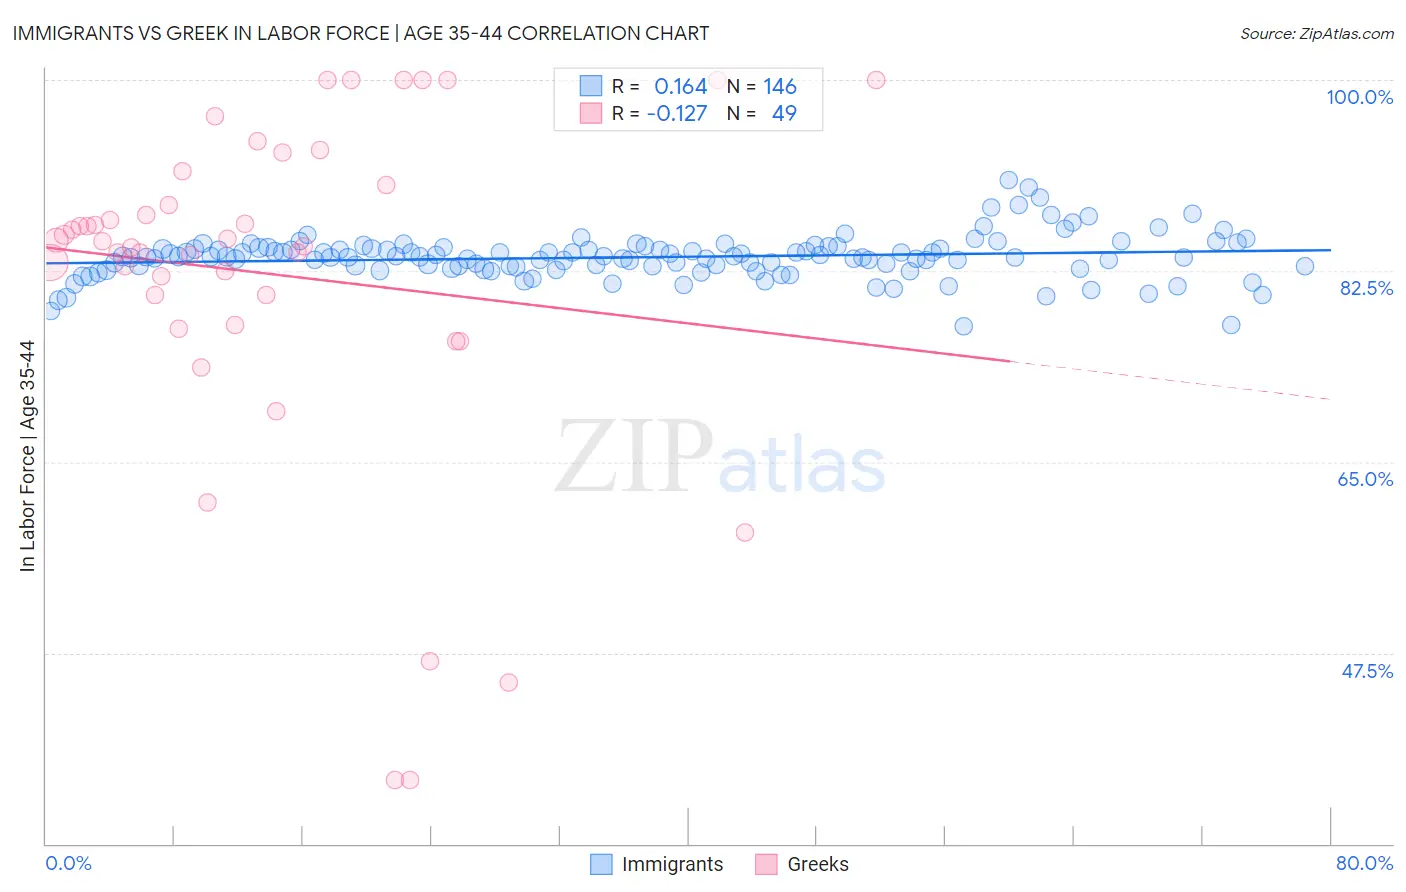
Immigrants vs Greek In Labor Force | Age 35-44 Correlation Chart
The statistical analysis conducted on geographies consisting of 576,964,624 people shows a poor positive correlation between the proportion of Immigrants and labor force participation rate among population between the ages 35 and 44 in the United States with a correlation coefficient (R) of 0.164 and weighted average of 83.7%. Similarly, the statistical analysis conducted on geographies consisting of 482,395,724 people shows a poor negative correlation between the proportion of Greeks and labor force participation rate among population between the ages 35 and 44 in the United States with a correlation coefficient (R) of -0.127 and weighted average of 84.9%, a difference of 1.4%.
In Labor Force | Age 35-44 Correlation Summary
| Measurement | Immigrants | Greek |
| Minimum | 77.4% | 35.9% |
| Maximum | 90.8% | 100.0% |
| Range | 13.4% | 64.1% |
| Mean | 83.8% | 82.2% |
| Median | 83.8% | 85.2% |
| Interquartile 25% (IQ1) | 82.9% | 78.9% |
| Interquartile 75% (IQ3) | 84.6% | 91.0% |
| Interquartile Range (IQR) | 1.7% | 12.1% |
| Standard Deviation (Sample) | 2.0% | 15.5% |
| Standard Deviation (Population) | 2.0% | 15.4% |
Similar Demographics by In Labor Force | Age 35-44
Demographics Similar to Immigrants by In Labor Force | Age 35-44
In terms of in labor force | age 35-44, the demographic groups most similar to Immigrants are Guyanese (83.8%, a difference of 0.010%), Malaysian (83.8%, a difference of 0.010%), Immigrants from Cambodia (83.8%, a difference of 0.020%), Immigrants from Western Asia (83.8%, a difference of 0.020%), and Immigrants from Armenia (83.7%, a difference of 0.020%).
| Demographics | Rating | Rank | In Labor Force | Age 35-44 |
| Celtics | 1.4 /100 | #239 | Tragic 83.8% |
| Arabs | 1.3 /100 | #240 | Tragic 83.8% |
| Iraqis | 1.3 /100 | #241 | Tragic 83.8% |
| Immigrants | Cambodia | 1.1 /100 | #242 | Tragic 83.8% |
| Immigrants | Western Asia | 1.1 /100 | #243 | Tragic 83.8% |
| Guyanese | 1.1 /100 | #244 | Tragic 83.8% |
| Malaysians | 1.1 /100 | #245 | Tragic 83.8% |
| Immigrants | Immigrants | 1.0 /100 | #246 | Tragic 83.7% |
| Immigrants | Armenia | 0.9 /100 | #247 | Tragic 83.7% |
| Indonesians | 0.8 /100 | #248 | Tragic 83.7% |
| Immigrants | St. Vincent and the Grenadines | 0.7 /100 | #249 | Tragic 83.7% |
| Whites/Caucasians | 0.5 /100 | #250 | Tragic 83.6% |
| Salvadorans | 0.4 /100 | #251 | Tragic 83.6% |
| Immigrants | Guyana | 0.4 /100 | #252 | Tragic 83.6% |
| Lebanese | 0.4 /100 | #253 | Tragic 83.6% |
Demographics Similar to Greeks by In Labor Force | Age 35-44
In terms of in labor force | age 35-44, the demographic groups most similar to Greeks are Senegalese (84.9%, a difference of 0.0%), Immigrants from Peru (84.9%, a difference of 0.0%), Immigrants from Middle Africa (84.9%, a difference of 0.0%), Belgian (84.9%, a difference of 0.0%), and Yugoslavian (84.9%, a difference of 0.0%).
| Demographics | Rating | Rank | In Labor Force | Age 35-44 |
| Peruvians | 98.3 /100 | #79 | Exceptional 84.9% |
| Immigrants | Colombia | 98.3 /100 | #80 | Exceptional 84.9% |
| Immigrants | Eastern Europe | 98.3 /100 | #81 | Exceptional 84.9% |
| Immigrants | Sudan | 98.1 /100 | #82 | Exceptional 84.9% |
| Senegalese | 97.8 /100 | #83 | Exceptional 84.9% |
| Immigrants | Peru | 97.8 /100 | #84 | Exceptional 84.9% |
| Immigrants | Middle Africa | 97.8 /100 | #85 | Exceptional 84.9% |
| Greeks | 97.8 /100 | #86 | Exceptional 84.9% |
| Belgians | 97.7 /100 | #87 | Exceptional 84.9% |
| Yugoslavians | 97.7 /100 | #88 | Exceptional 84.9% |
| Immigrants | Pakistan | 97.5 /100 | #89 | Exceptional 84.9% |
| Immigrants | France | 97.4 /100 | #90 | Exceptional 84.9% |
| Immigrants | Europe | 97.2 /100 | #91 | Exceptional 84.9% |
| Ghanaians | 97.2 /100 | #92 | Exceptional 84.8% |
| Immigrants | Northern Africa | 97.1 /100 | #93 | Exceptional 84.8% |