Immigrants from Zaire vs Cape Verdean In Labor Force | Age > 16
COMPARE
Immigrants from Zaire
Cape Verdean
In Labor Force | Age > 16
In Labor Force | Age > 16 Comparison
Immigrants from Zaire
Cape Verdeans
67.2%
IN LABOR FORCE | AGE > 16
100.0/ 100
METRIC RATING
30th/ 347
METRIC RANK
66.6%
IN LABOR FORCE | AGE > 16
100.0/ 100
METRIC RATING
50th/ 347
METRIC RANK
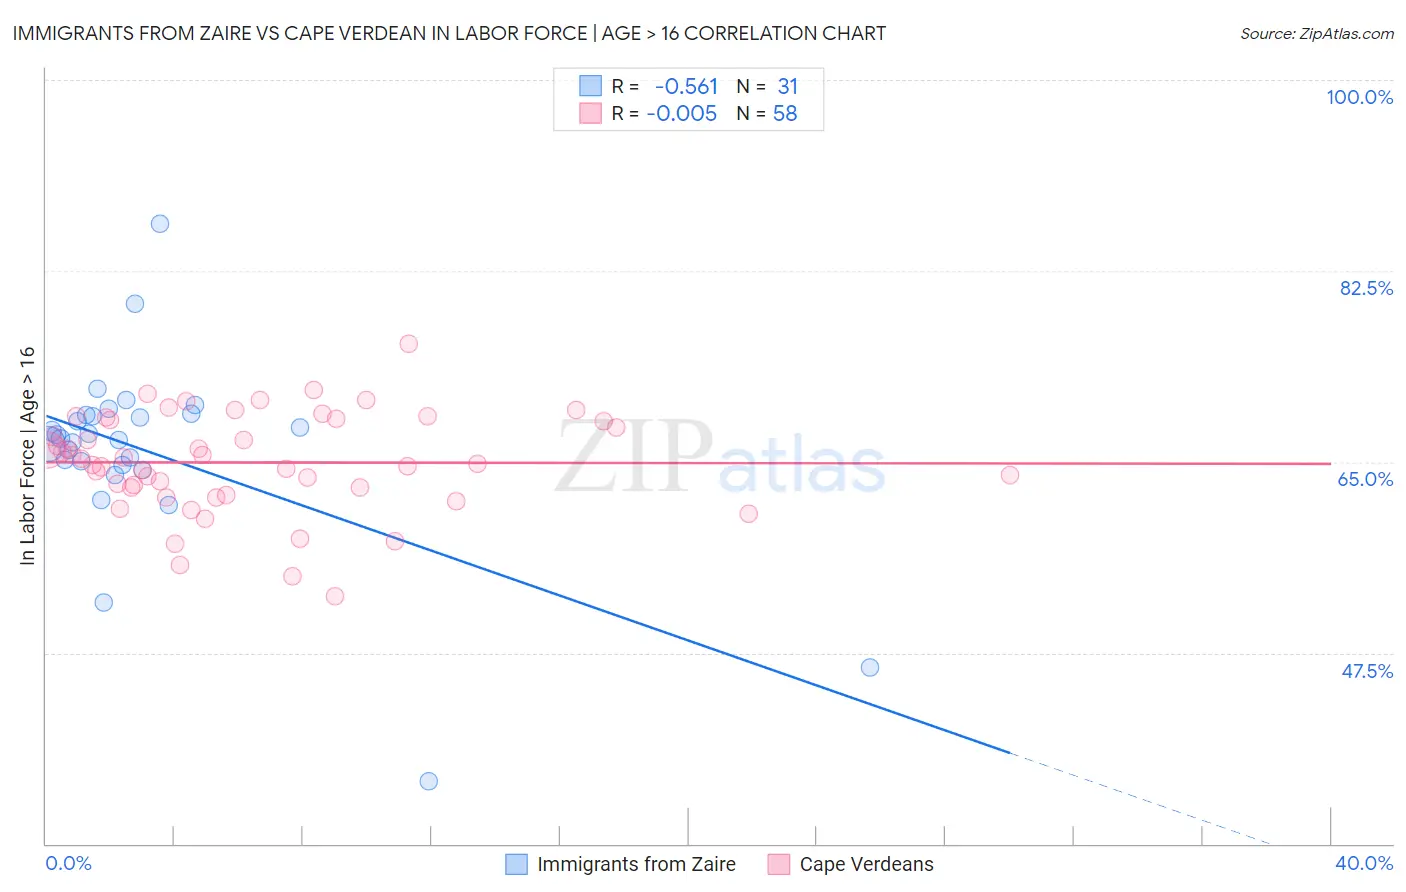
Immigrants from Zaire vs Cape Verdean In Labor Force | Age > 16 Correlation Chart
The statistical analysis conducted on geographies consisting of 107,255,436 people shows a substantial negative correlation between the proportion of Immigrants from Zaire and labor force participation rate among population ages 16 and over in the United States with a correlation coefficient (R) of -0.561 and weighted average of 67.2%. Similarly, the statistical analysis conducted on geographies consisting of 107,578,429 people shows no correlation between the proportion of Cape Verdeans and labor force participation rate among population ages 16 and over in the United States with a correlation coefficient (R) of -0.005 and weighted average of 66.6%, a difference of 0.97%.
In Labor Force | Age > 16 Correlation Summary
| Measurement | Immigrants from Zaire | Cape Verdean |
| Minimum | 35.7% | 52.7% |
| Maximum | 86.8% | 75.8% |
| Range | 51.1% | 23.1% |
| Mean | 65.9% | 64.9% |
| Median | 67.2% | 65.0% |
| Interquartile 25% (IQ1) | 64.7% | 62.6% |
| Interquartile 75% (IQ3) | 69.3% | 68.9% |
| Interquartile Range (IQR) | 4.6% | 6.3% |
| Standard Deviation (Sample) | 8.8% | 4.6% |
| Standard Deviation (Population) | 8.7% | 4.5% |
Demographics Similar to Immigrants from Zaire and Cape Verdeans by In Labor Force | Age > 16
In terms of in labor force | age > 16, the demographic groups most similar to Immigrants from Zaire are Ghanaian (67.1%, a difference of 0.10%), Immigrants from Congo (67.1%, a difference of 0.16%), Afghan (67.1%, a difference of 0.16%), Immigrants from Ghana (67.1%, a difference of 0.17%), and Immigrants from South Central Asia (67.1%, a difference of 0.22%). Similarly, the demographic groups most similar to Cape Verdeans are Immigrants from Northern Africa (66.6%, a difference of 0.050%), Nigerian (66.6%, a difference of 0.070%), Brazilian (66.6%, a difference of 0.080%), Immigrants from Bulgaria (66.6%, a difference of 0.080%), and Immigrants from Brazil (66.7%, a difference of 0.15%).
| Demographics | Rating | Rank | In Labor Force | Age > 16 |
| Immigrants | Zaire | 100.0 /100 | #30 | Exceptional 67.2% |
| Ghanaians | 100.0 /100 | #31 | Exceptional 67.1% |
| Immigrants | Congo | 100.0 /100 | #32 | Exceptional 67.1% |
| Afghans | 100.0 /100 | #33 | Exceptional 67.1% |
| Immigrants | Ghana | 100.0 /100 | #34 | Exceptional 67.1% |
| Immigrants | South Central Asia | 100.0 /100 | #35 | Exceptional 67.1% |
| Immigrants | Western Africa | 100.0 /100 | #36 | Exceptional 67.1% |
| Immigrants | Afghanistan | 100.0 /100 | #37 | Exceptional 67.0% |
| Immigrants | Nigeria | 100.0 /100 | #38 | Exceptional 66.9% |
| Salvadorans | 100.0 /100 | #39 | Exceptional 66.8% |
| Immigrants | El Salvador | 100.0 /100 | #40 | Exceptional 66.8% |
| Immigrants | Zimbabwe | 100.0 /100 | #41 | Exceptional 66.8% |
| Senegalese | 100.0 /100 | #42 | Exceptional 66.7% |
| Luxembourgers | 100.0 /100 | #43 | Exceptional 66.7% |
| Immigrants | Pakistan | 100.0 /100 | #44 | Exceptional 66.7% |
| Immigrants | Brazil | 100.0 /100 | #45 | Exceptional 66.7% |
| Brazilians | 100.0 /100 | #46 | Exceptional 66.6% |
| Immigrants | Bulgaria | 100.0 /100 | #47 | Exceptional 66.6% |
| Nigerians | 100.0 /100 | #48 | Exceptional 66.6% |
| Immigrants | Northern Africa | 100.0 /100 | #49 | Exceptional 66.6% |
| Cape Verdeans | 100.0 /100 | #50 | Exceptional 66.6% |