Immigrants from Venezuela vs Immigrants from Nicaragua In Labor Force | Age 20-64
COMPARE
Immigrants from Venezuela
Immigrants from Nicaragua
In Labor Force | Age 20-64
In Labor Force | Age 20-64 Comparison
Immigrants from Venezuela
Immigrants from Nicaragua
80.1%
IN LABOR FORCE | AGE 20-64
96.8/ 100
METRIC RATING
89th/ 347
METRIC RANK
79.3%
IN LABOR FORCE | AGE 20-64
19.0/ 100
METRIC RATING
201st/ 347
METRIC RANK
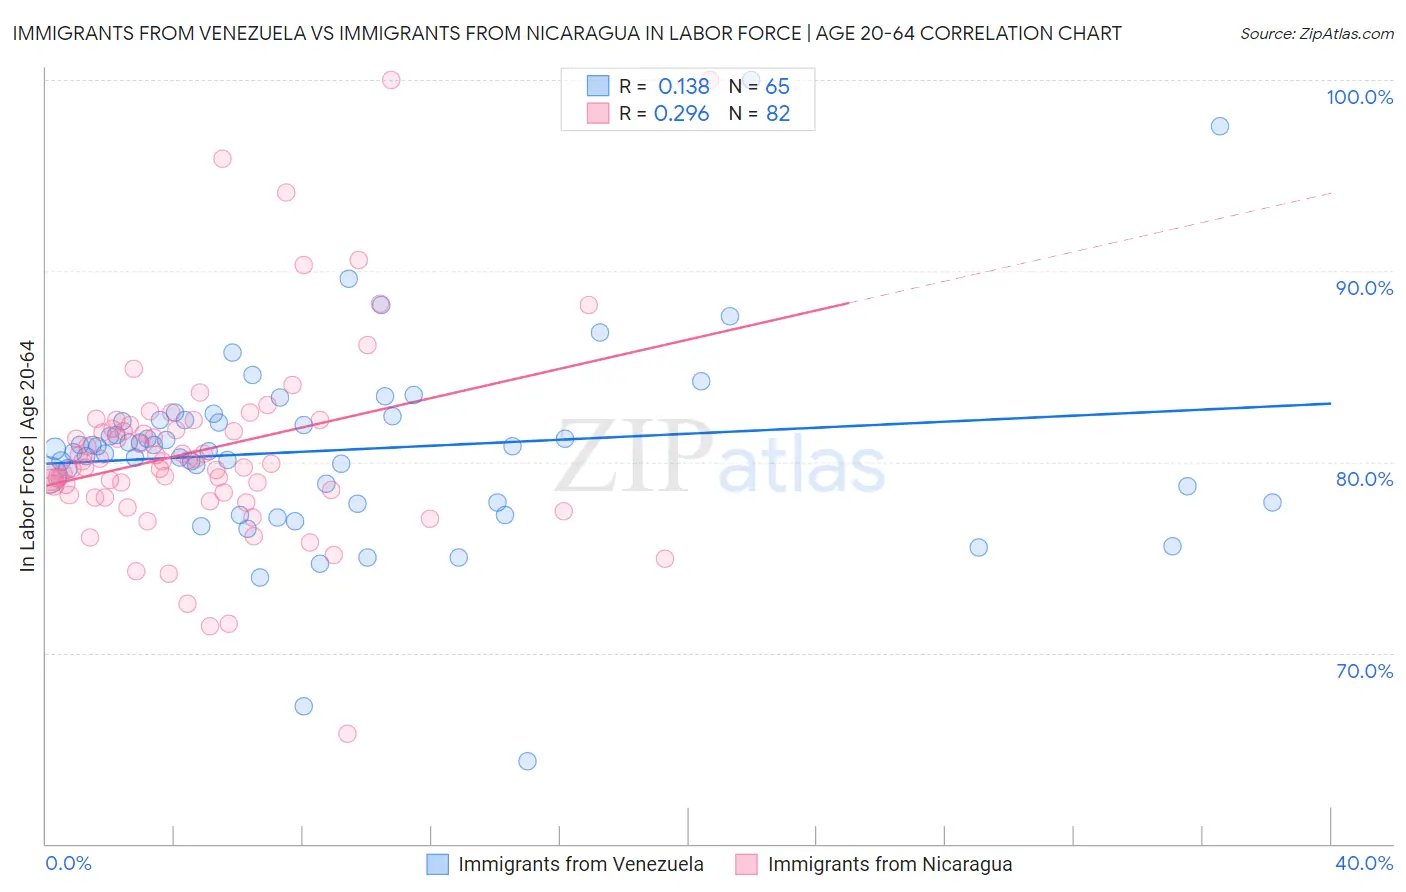
Immigrants from Venezuela vs Immigrants from Nicaragua In Labor Force | Age 20-64 Correlation Chart
The statistical analysis conducted on geographies consisting of 287,871,392 people shows a poor positive correlation between the proportion of Immigrants from Venezuela and labor force participation rate among population between the ages 20 and 64 in the United States with a correlation coefficient (R) of 0.138 and weighted average of 80.1%. Similarly, the statistical analysis conducted on geographies consisting of 236,331,961 people shows a weak positive correlation between the proportion of Immigrants from Nicaragua and labor force participation rate among population between the ages 20 and 64 in the United States with a correlation coefficient (R) of 0.296 and weighted average of 79.3%, a difference of 0.98%.
In Labor Force | Age 20-64 Correlation Summary
| Measurement | Immigrants from Venezuela | Immigrants from Nicaragua |
| Minimum | 64.3% | 65.7% |
| Maximum | 100.0% | 100.0% |
| Range | 35.7% | 34.3% |
| Mean | 80.6% | 80.6% |
| Median | 80.7% | 80.0% |
| Interquartile 25% (IQ1) | 77.9% | 78.2% |
| Interquartile 75% (IQ3) | 82.2% | 81.9% |
| Interquartile Range (IQR) | 4.3% | 3.7% |
| Standard Deviation (Sample) | 5.2% | 5.4% |
| Standard Deviation (Population) | 5.2% | 5.4% |
Similar Demographics by In Labor Force | Age 20-64
Demographics Similar to Immigrants from Venezuela by In Labor Force | Age 20-64
In terms of in labor force | age 20-64, the demographic groups most similar to Immigrants from Venezuela are Polish (80.1%, a difference of 0.0%), Chilean (80.1%, a difference of 0.010%), Uruguayan (80.1%, a difference of 0.010%), Ghanaian (80.1%, a difference of 0.010%), and Jordanian (80.1%, a difference of 0.020%).
| Demographics | Rating | Rank | In Labor Force | Age 20-64 |
| Immigrants | Japan | 97.3 /100 | #82 | Exceptional 80.1% |
| Colombians | 97.3 /100 | #83 | Exceptional 80.1% |
| Immigrants | Latvia | 97.2 /100 | #84 | Exceptional 80.1% |
| Jordanians | 97.2 /100 | #85 | Exceptional 80.1% |
| Immigrants | Egypt | 97.1 /100 | #86 | Exceptional 80.1% |
| Croatians | 97.1 /100 | #87 | Exceptional 80.1% |
| Chileans | 97.0 /100 | #88 | Exceptional 80.1% |
| Immigrants | Venezuela | 96.8 /100 | #89 | Exceptional 80.1% |
| Poles | 96.8 /100 | #90 | Exceptional 80.1% |
| Uruguayans | 96.7 /100 | #91 | Exceptional 80.1% |
| Ghanaians | 96.7 /100 | #92 | Exceptional 80.1% |
| Immigrants | Belarus | 96.4 /100 | #93 | Exceptional 80.1% |
| Immigrants | Asia | 96.0 /100 | #94 | Exceptional 80.1% |
| Yugoslavians | 95.9 /100 | #95 | Exceptional 80.1% |
| Immigrants | Malaysia | 95.9 /100 | #96 | Exceptional 80.1% |
Demographics Similar to Immigrants from Nicaragua by In Labor Force | Age 20-64
In terms of in labor force | age 20-64, the demographic groups most similar to Immigrants from Nicaragua are Immigrants from Oceania (79.3%, a difference of 0.0%), Nicaraguan (79.3%, a difference of 0.010%), Dutch (79.3%, a difference of 0.020%), Iraqi (79.3%, a difference of 0.020%), and Immigrants from Cambodia (79.3%, a difference of 0.020%).
| Demographics | Rating | Rank | In Labor Force | Age 20-64 |
| Immigrants | Thailand | 24.8 /100 | #194 | Fair 79.4% |
| Immigrants | Austria | 23.7 /100 | #195 | Fair 79.4% |
| Ecuadorians | 23.1 /100 | #196 | Fair 79.4% |
| Immigrants | Senegal | 22.5 /100 | #197 | Fair 79.4% |
| Immigrants | Laos | 21.5 /100 | #198 | Fair 79.4% |
| Dutch | 20.2 /100 | #199 | Fair 79.3% |
| Immigrants | Oceania | 19.1 /100 | #200 | Poor 79.3% |
| Immigrants | Nicaragua | 19.0 /100 | #201 | Poor 79.3% |
| Nicaraguans | 18.3 /100 | #202 | Poor 79.3% |
| Iraqis | 17.7 /100 | #203 | Poor 79.3% |
| Immigrants | Cambodia | 17.6 /100 | #204 | Poor 79.3% |
| Immigrants | Congo | 17.5 /100 | #205 | Poor 79.3% |
| Immigrants | Ecuador | 16.9 /100 | #206 | Poor 79.3% |
| Sub-Saharan Africans | 16.5 /100 | #207 | Poor 79.3% |
| British | 16.5 /100 | #208 | Poor 79.3% |