Immigrants from Uganda vs Immigrants from Philippines In Labor Force | Age 25-29
COMPARE
Immigrants from Uganda
Immigrants from Philippines
In Labor Force | Age 25-29
In Labor Force | Age 25-29 Comparison
Immigrants from Uganda
Immigrants from Philippines
86.0%
IN LABOR FORCE | AGE 25-29
100.0/ 100
METRIC RATING
23rd/ 347
METRIC RANK
84.2%
IN LABOR FORCE | AGE 25-29
4.7/ 100
METRIC RATING
231st/ 347
METRIC RANK
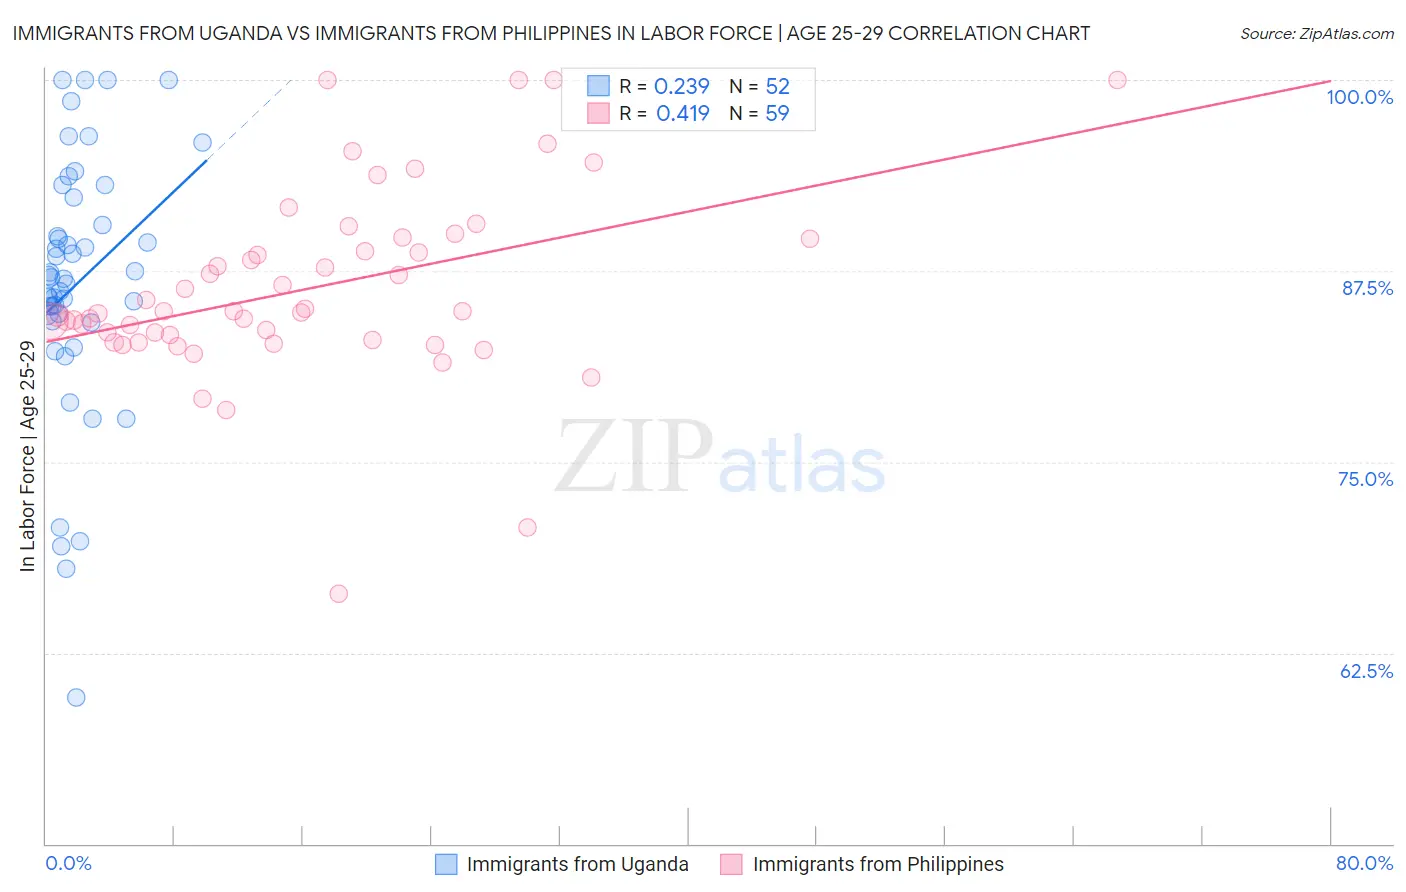
Immigrants from Uganda vs Immigrants from Philippines In Labor Force | Age 25-29 Correlation Chart
The statistical analysis conducted on geographies consisting of 125,979,949 people shows a weak positive correlation between the proportion of Immigrants from Uganda and labor force participation rate among population between the ages 25 and 29 in the United States with a correlation coefficient (R) of 0.239 and weighted average of 86.0%. Similarly, the statistical analysis conducted on geographies consisting of 471,084,239 people shows a moderate positive correlation between the proportion of Immigrants from Philippines and labor force participation rate among population between the ages 25 and 29 in the United States with a correlation coefficient (R) of 0.419 and weighted average of 84.2%, a difference of 2.1%.
In Labor Force | Age 25-29 Correlation Summary
| Measurement | Immigrants from Uganda | Immigrants from Philippines |
| Minimum | 59.6% | 66.4% |
| Maximum | 100.0% | 100.0% |
| Range | 40.4% | 33.6% |
| Mean | 86.7% | 86.4% |
| Median | 87.0% | 84.9% |
| Interquartile 25% (IQ1) | 84.5% | 83.0% |
| Interquartile 75% (IQ3) | 91.4% | 89.6% |
| Interquartile Range (IQR) | 6.9% | 6.6% |
| Standard Deviation (Sample) | 8.4% | 6.2% |
| Standard Deviation (Population) | 8.4% | 6.2% |
Similar Demographics by In Labor Force | Age 25-29
Demographics Similar to Immigrants from Uganda by In Labor Force | Age 25-29
In terms of in labor force | age 25-29, the demographic groups most similar to Immigrants from Uganda are Immigrants from Eastern Africa (86.0%, a difference of 0.010%), Cambodian (86.0%, a difference of 0.020%), Sudanese (85.9%, a difference of 0.020%), Maltese (86.0%, a difference of 0.030%), and Immigrants from Ireland (86.0%, a difference of 0.040%).
| Demographics | Rating | Rank | In Labor Force | Age 25-29 |
| Immigrants | Bolivia | 100.0 /100 | #16 | Exceptional 86.1% |
| Bermudans | 100.0 /100 | #17 | Exceptional 86.0% |
| Bulgarians | 100.0 /100 | #18 | Exceptional 86.0% |
| Cape Verdeans | 100.0 /100 | #19 | Exceptional 86.0% |
| Immigrants | Ireland | 100.0 /100 | #20 | Exceptional 86.0% |
| Maltese | 100.0 /100 | #21 | Exceptional 86.0% |
| Cambodians | 100.0 /100 | #22 | Exceptional 86.0% |
| Immigrants | Uganda | 100.0 /100 | #23 | Exceptional 86.0% |
| Immigrants | Eastern Africa | 100.0 /100 | #24 | Exceptional 86.0% |
| Sudanese | 100.0 /100 | #25 | Exceptional 85.9% |
| Immigrants | North Macedonia | 100.0 /100 | #26 | Exceptional 85.9% |
| Paraguayans | 100.0 /100 | #27 | Exceptional 85.9% |
| Ugandans | 100.0 /100 | #28 | Exceptional 85.9% |
| Immigrants | Liberia | 100.0 /100 | #29 | Exceptional 85.9% |
| Immigrants | Serbia | 100.0 /100 | #30 | Exceptional 85.9% |
Demographics Similar to Immigrants from Philippines by In Labor Force | Age 25-29
In terms of in labor force | age 25-29, the demographic groups most similar to Immigrants from Philippines are Immigrants from Oceania (84.2%, a difference of 0.010%), White/Caucasian (84.2%, a difference of 0.010%), Panamanian (84.2%, a difference of 0.010%), French American Indian (84.2%, a difference of 0.030%), and Immigrants from Panama (84.2%, a difference of 0.030%).
| Demographics | Rating | Rank | In Labor Force | Age 25-29 |
| Immigrants | West Indies | 6.0 /100 | #224 | Tragic 84.2% |
| Koreans | 5.9 /100 | #225 | Tragic 84.2% |
| Immigrants | Congo | 5.8 /100 | #226 | Tragic 84.2% |
| French American Indians | 5.5 /100 | #227 | Tragic 84.2% |
| Immigrants | Panama | 5.5 /100 | #228 | Tragic 84.2% |
| Immigrants | Oceania | 5.0 /100 | #229 | Tragic 84.2% |
| Whites/Caucasians | 4.8 /100 | #230 | Tragic 84.2% |
| Immigrants | Philippines | 4.7 /100 | #231 | Tragic 84.2% |
| Panamanians | 4.5 /100 | #232 | Tragic 84.2% |
| Immigrants | Western Asia | 2.7 /100 | #233 | Tragic 84.1% |
| Barbadians | 1.0 /100 | #234 | Tragic 83.9% |
| Iraqis | 0.9 /100 | #235 | Tragic 83.9% |
| Guamanians/Chamorros | 0.9 /100 | #236 | Tragic 83.9% |
| Immigrants | Immigrants | 0.9 /100 | #237 | Tragic 83.9% |
| Immigrants | Uzbekistan | 0.8 /100 | #238 | Tragic 83.9% |