Immigrants from Thailand vs Native Hawaiian In Labor Force | Age 45-54
COMPARE
Immigrants from Thailand
Native Hawaiian
In Labor Force | Age 45-54
In Labor Force | Age 45-54 Comparison
Immigrants from Thailand
Native Hawaiians
81.9%
IN LABOR FORCE | AGE 45-54
1.0/ 100
METRIC RATING
239th/ 347
METRIC RANK
82.3%
IN LABOR FORCE | AGE 45-54
8.5/ 100
METRIC RATING
208th/ 347
METRIC RANK
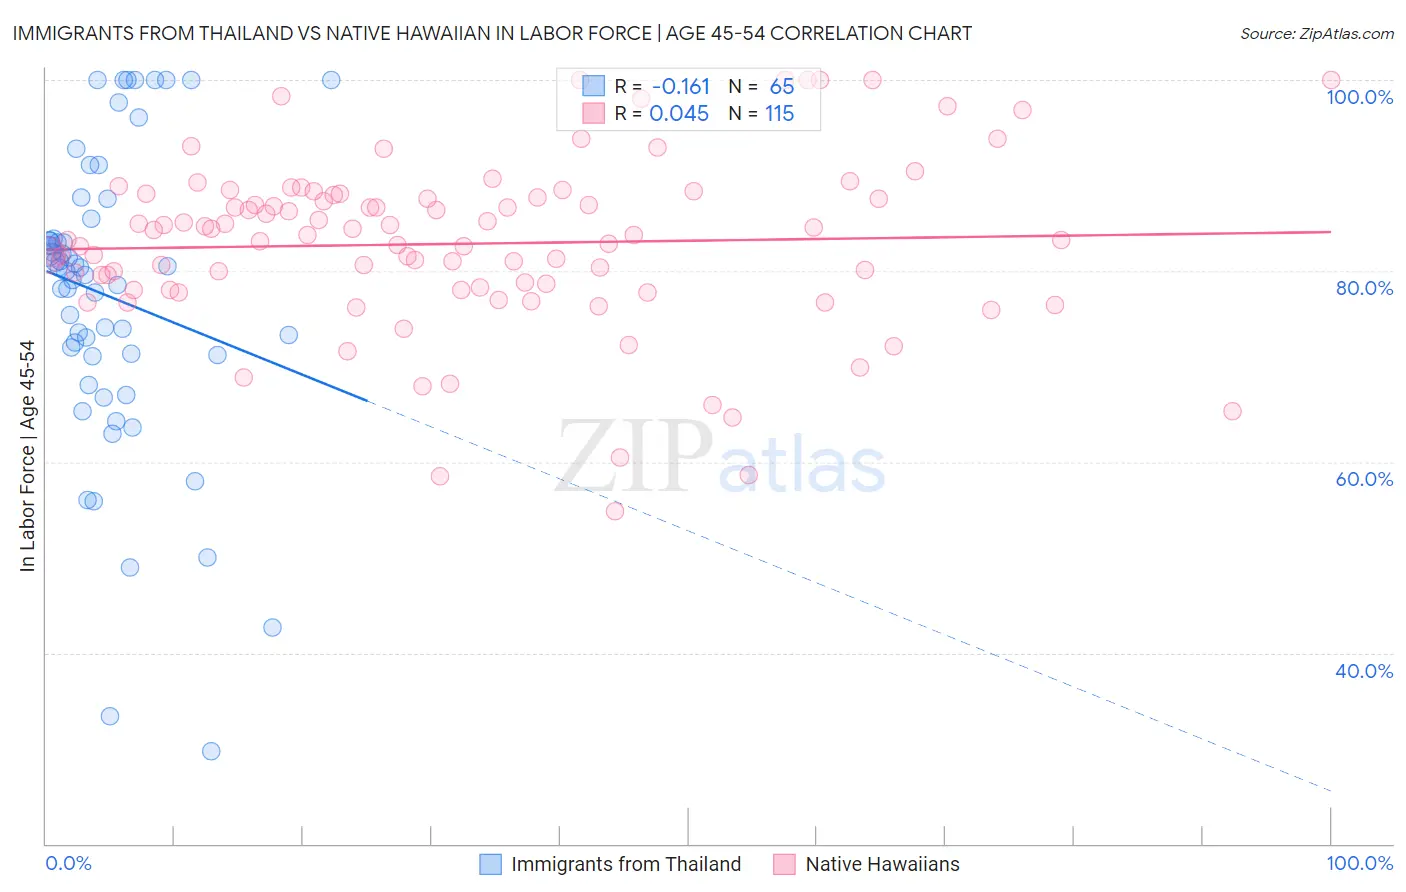
Immigrants from Thailand vs Native Hawaiian In Labor Force | Age 45-54 Correlation Chart
The statistical analysis conducted on geographies consisting of 316,914,814 people shows a poor negative correlation between the proportion of Immigrants from Thailand and labor force participation rate among population between the ages 45 and 54 in the United States with a correlation coefficient (R) of -0.161 and weighted average of 81.9%. Similarly, the statistical analysis conducted on geographies consisting of 331,883,944 people shows no correlation between the proportion of Native Hawaiians and labor force participation rate among population between the ages 45 and 54 in the United States with a correlation coefficient (R) of 0.045 and weighted average of 82.3%, a difference of 0.49%.
In Labor Force | Age 45-54 Correlation Summary
| Measurement | Immigrants from Thailand | Native Hawaiian |
| Minimum | 29.7% | 54.8% |
| Maximum | 100.0% | 100.0% |
| Range | 70.3% | 45.2% |
| Mean | 77.3% | 82.8% |
| Median | 80.0% | 83.7% |
| Interquartile 25% (IQ1) | 71.1% | 78.0% |
| Interquartile 75% (IQ3) | 84.4% | 88.0% |
| Interquartile Range (IQR) | 13.3% | 10.0% |
| Standard Deviation (Sample) | 15.6% | 9.0% |
| Standard Deviation (Population) | 15.5% | 9.0% |
Similar Demographics by In Labor Force | Age 45-54
Demographics Similar to Immigrants from Thailand by In Labor Force | Age 45-54
In terms of in labor force | age 45-54, the demographic groups most similar to Immigrants from Thailand are Immigrants from El Salvador (81.9%, a difference of 0.010%), Immigrants from Trinidad and Tobago (82.0%, a difference of 0.030%), Trinidadian and Tobagonian (81.9%, a difference of 0.030%), Subsaharan African (82.0%, a difference of 0.040%), and Basque (82.0%, a difference of 0.040%).
| Demographics | Rating | Rank | In Labor Force | Age 45-54 |
| Immigrants | Portugal | 1.7 /100 | #232 | Tragic 82.0% |
| Malaysians | 1.7 /100 | #233 | Tragic 82.0% |
| Salvadorans | 1.7 /100 | #234 | Tragic 82.0% |
| Sub-Saharan Africans | 1.2 /100 | #235 | Tragic 82.0% |
| Basques | 1.2 /100 | #236 | Tragic 82.0% |
| Immigrants | Trinidad and Tobago | 1.2 /100 | #237 | Tragic 82.0% |
| Trinidadians and Tobagonians | 1.1 /100 | #238 | Tragic 81.9% |
| Immigrants | Thailand | 1.0 /100 | #239 | Tragic 81.9% |
| Immigrants | El Salvador | 1.0 /100 | #240 | Tragic 81.9% |
| Immigrants | Cambodia | 0.8 /100 | #241 | Tragic 81.9% |
| Whites/Caucasians | 0.7 /100 | #242 | Tragic 81.9% |
| Samoans | 0.6 /100 | #243 | Tragic 81.8% |
| Celtics | 0.4 /100 | #244 | Tragic 81.8% |
| Alaska Natives | 0.4 /100 | #245 | Tragic 81.8% |
| Alaskan Athabascans | 0.4 /100 | #246 | Tragic 81.8% |
Demographics Similar to Native Hawaiians by In Labor Force | Age 45-54
In terms of in labor force | age 45-54, the demographic groups most similar to Native Hawaiians are Immigrants from Cabo Verde (82.3%, a difference of 0.0%), Welsh (82.3%, a difference of 0.020%), Senegalese (82.4%, a difference of 0.030%), Immigrants from Lebanon (82.3%, a difference of 0.030%), and Immigrants from Bahamas (82.3%, a difference of 0.040%).
| Demographics | Rating | Rank | In Labor Force | Age 45-54 |
| Canadians | 15.1 /100 | #201 | Poor 82.4% |
| Immigrants | Western Asia | 14.9 /100 | #202 | Poor 82.4% |
| Arabs | 11.6 /100 | #203 | Poor 82.4% |
| Immigrants | Western Europe | 10.9 /100 | #204 | Poor 82.4% |
| Senegalese | 9.5 /100 | #205 | Tragic 82.4% |
| Welsh | 9.2 /100 | #206 | Tragic 82.3% |
| Immigrants | Cabo Verde | 8.6 /100 | #207 | Tragic 82.3% |
| Native Hawaiians | 8.5 /100 | #208 | Tragic 82.3% |
| Immigrants | Lebanon | 7.4 /100 | #209 | Tragic 82.3% |
| Immigrants | Bahamas | 7.1 /100 | #210 | Tragic 82.3% |
| Immigrants | Syria | 6.6 /100 | #211 | Tragic 82.3% |
| Ecuadorians | 6.3 /100 | #212 | Tragic 82.3% |
| Immigrants | Uzbekistan | 5.8 /100 | #213 | Tragic 82.3% |
| Immigrants | Panama | 5.6 /100 | #214 | Tragic 82.2% |
| Iraqis | 5.6 /100 | #215 | Tragic 82.2% |