Immigrants from Sweden vs Samoan In Labor Force | Age 30-34
COMPARE
Immigrants from Sweden
Samoan
In Labor Force | Age 30-34
In Labor Force | Age 30-34 Comparison
Immigrants from Sweden
Samoans
85.6%
IN LABOR FORCE | AGE 30-34
99.8/ 100
METRIC RATING
48th/ 347
METRIC RANK
83.3%
IN LABOR FORCE | AGE 30-34
0.0/ 100
METRIC RATING
281st/ 347
METRIC RANK
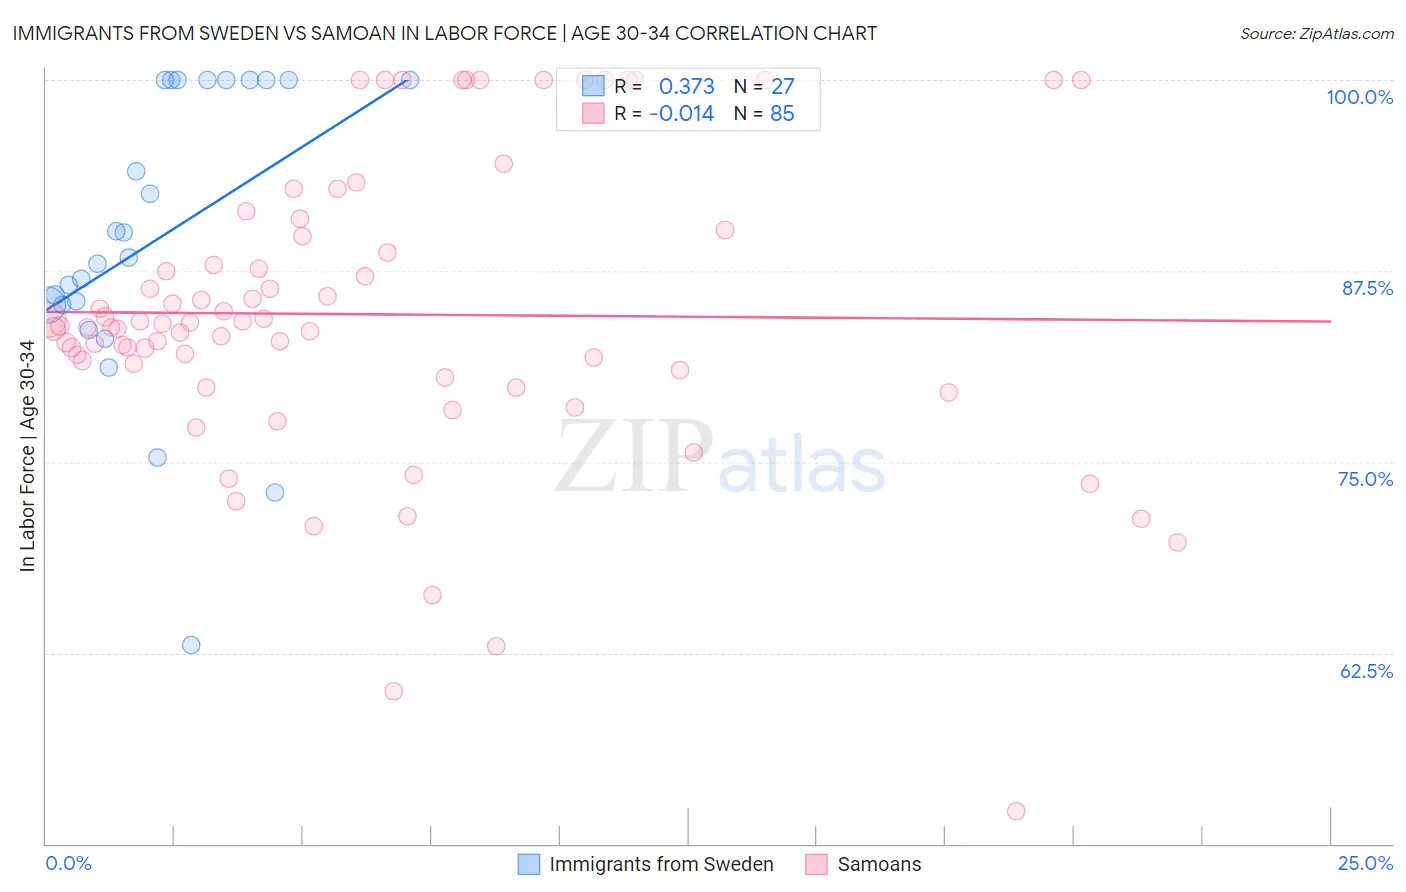
Immigrants from Sweden vs Samoan In Labor Force | Age 30-34 Correlation Chart
The statistical analysis conducted on geographies consisting of 164,705,447 people shows a mild positive correlation between the proportion of Immigrants from Sweden and labor force participation rate among population between the ages 30 and 34 in the United States with a correlation coefficient (R) of 0.373 and weighted average of 85.6%. Similarly, the statistical analysis conducted on geographies consisting of 225,110,068 people shows no correlation between the proportion of Samoans and labor force participation rate among population between the ages 30 and 34 in the United States with a correlation coefficient (R) of -0.014 and weighted average of 83.3%, a difference of 2.8%.
In Labor Force | Age 30-34 Correlation Summary
| Measurement | Immigrants from Sweden | Samoan |
| Minimum | 63.0% | 52.1% |
| Maximum | 100.0% | 100.0% |
| Range | 37.0% | 47.9% |
| Mean | 89.5% | 84.7% |
| Median | 88.4% | 83.9% |
| Interquartile 25% (IQ1) | 85.3% | 80.7% |
| Interquartile 75% (IQ3) | 100.0% | 90.0% |
| Interquartile Range (IQR) | 14.7% | 9.2% |
| Standard Deviation (Sample) | 9.7% | 9.8% |
| Standard Deviation (Population) | 9.5% | 9.7% |
Similar Demographics by In Labor Force | Age 30-34
Demographics Similar to Immigrants from Sweden by In Labor Force | Age 30-34
In terms of in labor force | age 30-34, the demographic groups most similar to Immigrants from Sweden are Lithuanian (85.6%, a difference of 0.010%), Immigrants from Australia (85.6%, a difference of 0.010%), Immigrants from Morocco (85.6%, a difference of 0.020%), Croatian (85.6%, a difference of 0.020%), and Immigrants from Sri Lanka (85.6%, a difference of 0.030%).
| Demographics | Rating | Rank | In Labor Force | Age 30-34 |
| Immigrants | Italy | 99.9 /100 | #41 | Exceptional 85.7% |
| Zimbabweans | 99.8 /100 | #42 | Exceptional 85.6% |
| Immigrants | Lithuania | 99.8 /100 | #43 | Exceptional 85.6% |
| Immigrants | Sri Lanka | 99.8 /100 | #44 | Exceptional 85.6% |
| Immigrants | Nepal | 99.8 /100 | #45 | Exceptional 85.6% |
| Immigrants | Morocco | 99.8 /100 | #46 | Exceptional 85.6% |
| Croatians | 99.8 /100 | #47 | Exceptional 85.6% |
| Immigrants | Sweden | 99.8 /100 | #48 | Exceptional 85.6% |
| Lithuanians | 99.8 /100 | #49 | Exceptional 85.6% |
| Immigrants | Australia | 99.8 /100 | #50 | Exceptional 85.6% |
| Cape Verdeans | 99.7 /100 | #51 | Exceptional 85.6% |
| Slovenes | 99.7 /100 | #52 | Exceptional 85.6% |
| Filipinos | 99.6 /100 | #53 | Exceptional 85.5% |
| Immigrants | Kenya | 99.6 /100 | #54 | Exceptional 85.5% |
| Immigrants | Turkey | 99.6 /100 | #55 | Exceptional 85.5% |
Demographics Similar to Samoans by In Labor Force | Age 30-34
In terms of in labor force | age 30-34, the demographic groups most similar to Samoans are Mexican American Indian (83.2%, a difference of 0.040%), Assyrian/Chaldean/Syriac (83.2%, a difference of 0.050%), Immigrants from Belize (83.2%, a difference of 0.10%), Cree (83.2%, a difference of 0.10%), and African (83.4%, a difference of 0.14%).
| Demographics | Rating | Rank | In Labor Force | Age 30-34 |
| Belizeans | 0.0 /100 | #274 | Tragic 83.5% |
| Immigrants | Grenada | 0.0 /100 | #275 | Tragic 83.5% |
| Tongans | 0.0 /100 | #276 | Tragic 83.5% |
| Delaware | 0.0 /100 | #277 | Tragic 83.5% |
| Fijians | 0.0 /100 | #278 | Tragic 83.4% |
| Immigrants | Fiji | 0.0 /100 | #279 | Tragic 83.4% |
| Africans | 0.0 /100 | #280 | Tragic 83.4% |
| Samoans | 0.0 /100 | #281 | Tragic 83.3% |
| Mexican American Indians | 0.0 /100 | #282 | Tragic 83.2% |
| Assyrians/Chaldeans/Syriacs | 0.0 /100 | #283 | Tragic 83.2% |
| Immigrants | Belize | 0.0 /100 | #284 | Tragic 83.2% |
| Cree | 0.0 /100 | #285 | Tragic 83.2% |
| Immigrants | Latin America | 0.0 /100 | #286 | Tragic 83.1% |
| Native Hawaiians | 0.0 /100 | #287 | Tragic 83.0% |
| Central American Indians | 0.0 /100 | #288 | Tragic 83.0% |