Immigrants from Pakistan vs Immigrants from North America In Labor Force | Age 16-19
COMPARE
Immigrants from Pakistan
Immigrants from North America
In Labor Force | Age 16-19
In Labor Force | Age 16-19 Comparison
Immigrants from Pakistan
Immigrants from North America
34.8%
IN LABOR FORCE | AGE 16-19
2.0/ 100
METRIC RATING
250th/ 347
METRIC RANK
38.9%
IN LABOR FORCE | AGE 16-19
99.4/ 100
METRIC RATING
95th/ 347
METRIC RANK
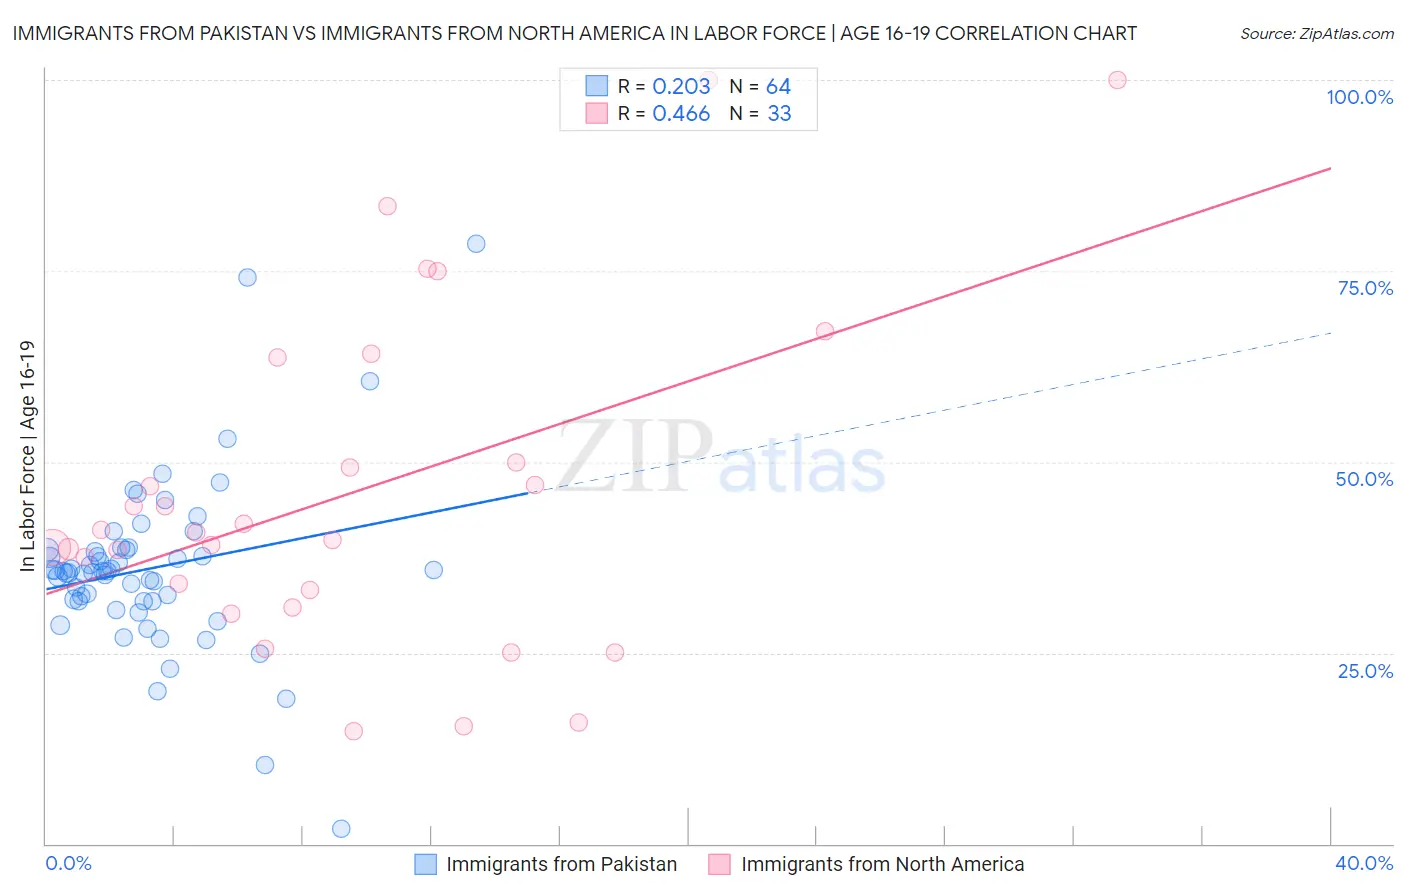
Immigrants from Pakistan vs Immigrants from North America In Labor Force | Age 16-19 Correlation Chart
The statistical analysis conducted on geographies consisting of 283,687,776 people shows a weak positive correlation between the proportion of Immigrants from Pakistan and labor force participation rate among population between the ages 16 and 19 in the United States with a correlation coefficient (R) of 0.203 and weighted average of 34.8%. Similarly, the statistical analysis conducted on geographies consisting of 461,140,424 people shows a moderate positive correlation between the proportion of Immigrants from North America and labor force participation rate among population between the ages 16 and 19 in the United States with a correlation coefficient (R) of 0.466 and weighted average of 38.9%, a difference of 11.8%.
In Labor Force | Age 16-19 Correlation Summary
| Measurement | Immigrants from Pakistan | Immigrants from North America |
| Minimum | 2.0% | 14.7% |
| Maximum | 78.6% | 100.0% |
| Range | 76.6% | 85.3% |
| Mean | 36.0% | 45.9% |
| Median | 35.7% | 40.7% |
| Interquartile 25% (IQ1) | 31.8% | 32.1% |
| Interquartile 75% (IQ3) | 38.5% | 56.8% |
| Interquartile Range (IQR) | 6.7% | 24.7% |
| Standard Deviation (Sample) | 11.4% | 21.9% |
| Standard Deviation (Population) | 11.3% | 21.6% |
Similar Demographics by In Labor Force | Age 16-19
Demographics Similar to Immigrants from Pakistan by In Labor Force | Age 16-19
In terms of in labor force | age 16-19, the demographic groups most similar to Immigrants from Pakistan are Immigrants from Western Asia (34.8%, a difference of 0.020%), Immigrants from Chile (34.8%, a difference of 0.030%), Immigrants from Ukraine (34.8%, a difference of 0.10%), Central American (34.8%, a difference of 0.13%), and Laotian (34.9%, a difference of 0.21%).
| Demographics | Rating | Rank | In Labor Force | Age 16-19 |
| Pueblo | 2.6 /100 | #243 | Tragic 34.9% |
| Immigrants | Turkey | 2.6 /100 | #244 | Tragic 34.9% |
| Immigrants | Greece | 2.4 /100 | #245 | Tragic 34.9% |
| Immigrants | Sri Lanka | 2.4 /100 | #246 | Tragic 34.9% |
| Laotians | 2.4 /100 | #247 | Tragic 34.9% |
| Central Americans | 2.2 /100 | #248 | Tragic 34.8% |
| Immigrants | Ukraine | 2.2 /100 | #249 | Tragic 34.8% |
| Immigrants | Pakistan | 2.0 /100 | #250 | Tragic 34.8% |
| Immigrants | Western Asia | 2.0 /100 | #251 | Tragic 34.8% |
| Immigrants | Chile | 2.0 /100 | #252 | Tragic 34.8% |
| Immigrants | Japan | 1.5 /100 | #253 | Tragic 34.7% |
| Bahamians | 1.4 /100 | #254 | Tragic 34.6% |
| Peruvians | 1.4 /100 | #255 | Tragic 34.6% |
| Immigrants | South Central Asia | 1.3 /100 | #256 | Tragic 34.6% |
| Immigrants | Egypt | 1.2 /100 | #257 | Tragic 34.6% |
Demographics Similar to Immigrants from North America by In Labor Force | Age 16-19
In terms of in labor force | age 16-19, the demographic groups most similar to Immigrants from North America are Latvian (38.9%, a difference of 0.030%), Greek (38.9%, a difference of 0.070%), Ugandan (38.9%, a difference of 0.080%), Blackfeet (38.9%, a difference of 0.090%), and Immigrants from Canada (38.9%, a difference of 0.090%).
| Demographics | Rating | Rank | In Labor Force | Age 16-19 |
| Puget Sound Salish | 99.6 /100 | #88 | Exceptional 39.1% |
| Alaska Natives | 99.6 /100 | #89 | Exceptional 39.1% |
| Immigrants | Burma/Myanmar | 99.5 /100 | #90 | Exceptional 39.0% |
| Spanish Americans | 99.5 /100 | #91 | Exceptional 39.0% |
| Osage | 99.4 /100 | #92 | Exceptional 39.0% |
| Blackfeet | 99.4 /100 | #93 | Exceptional 38.9% |
| Immigrants | Canada | 99.4 /100 | #94 | Exceptional 38.9% |
| Immigrants | North America | 99.4 /100 | #95 | Exceptional 38.9% |
| Latvians | 99.4 /100 | #96 | Exceptional 38.9% |
| Greeks | 99.3 /100 | #97 | Exceptional 38.9% |
| Ugandans | 99.3 /100 | #98 | Exceptional 38.9% |
| Immigrants | North Macedonia | 99.3 /100 | #99 | Exceptional 38.9% |
| Immigrants | Thailand | 99.1 /100 | #100 | Exceptional 38.7% |
| Hmong | 99.1 /100 | #101 | Exceptional 38.7% |
| Zimbabweans | 99.1 /100 | #102 | Exceptional 38.7% |