Immigrants from Northern Africa vs Immigrants from Southern Europe In Labor Force | Age 20-24
COMPARE
Immigrants from Northern Africa
Immigrants from Southern Europe
In Labor Force | Age 20-24
In Labor Force | Age 20-24 Comparison
Immigrants from Northern Africa
Immigrants from Southern Europe
74.6%
IN LABOR FORCE | AGE 20-24
17.9/ 100
METRIC RATING
203rd/ 347
METRIC RANK
74.5%
IN LABOR FORCE | AGE 20-24
13.2/ 100
METRIC RATING
214th/ 347
METRIC RANK
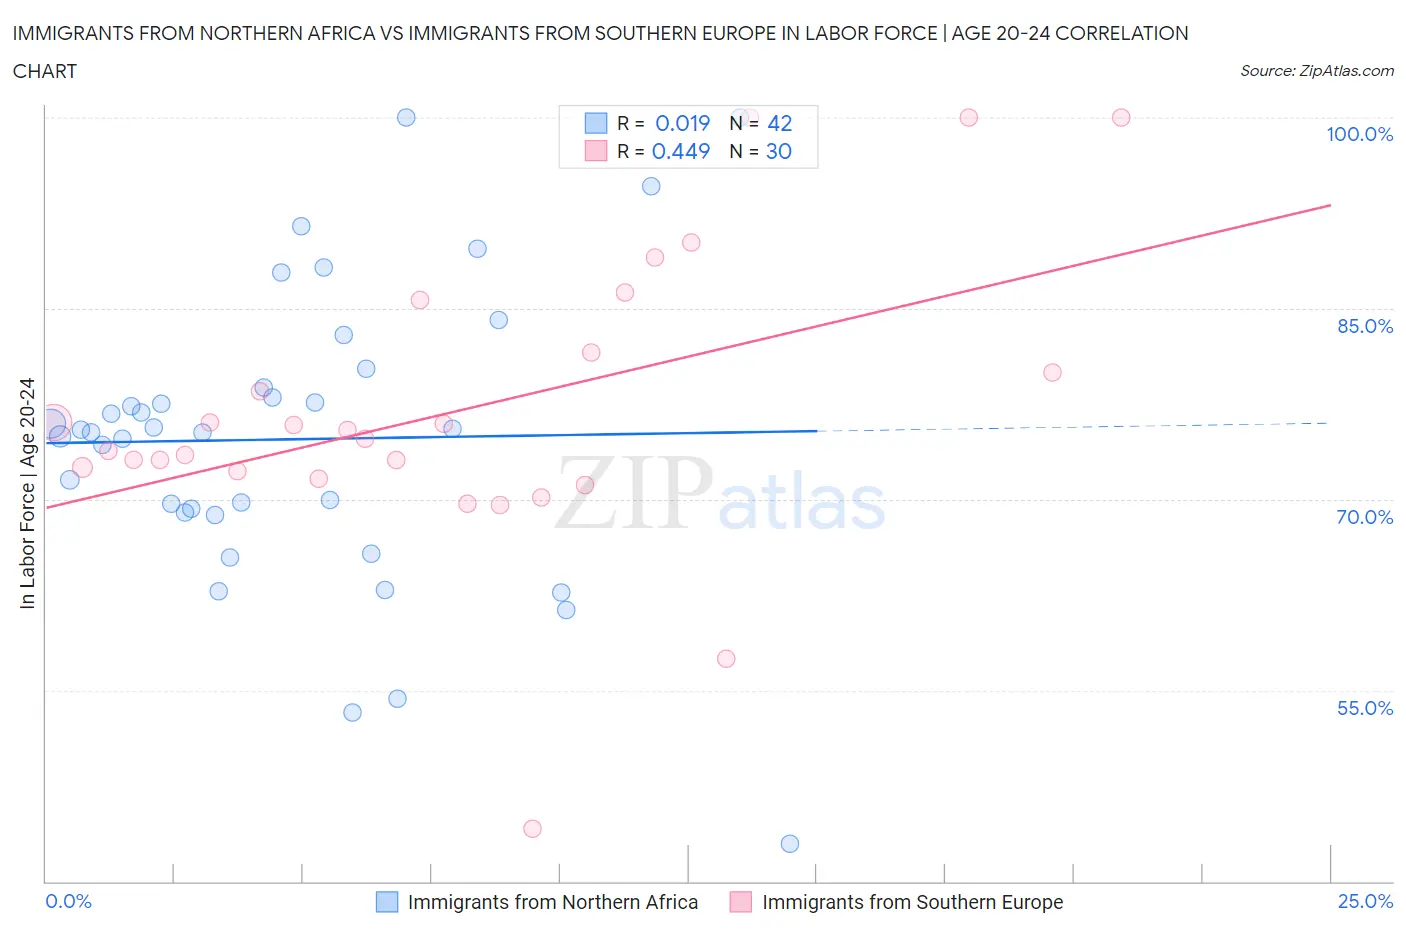
Immigrants from Northern Africa vs Immigrants from Southern Europe In Labor Force | Age 20-24 Correlation Chart
The statistical analysis conducted on geographies consisting of 321,123,138 people shows no correlation between the proportion of Immigrants from Northern Africa and labor force participation rate among population between the ages 20 and 24 in the United States with a correlation coefficient (R) of 0.019 and weighted average of 74.6%. Similarly, the statistical analysis conducted on geographies consisting of 402,559,675 people shows a moderate positive correlation between the proportion of Immigrants from Southern Europe and labor force participation rate among population between the ages 20 and 24 in the United States with a correlation coefficient (R) of 0.449 and weighted average of 74.5%, a difference of 0.13%.
In Labor Force | Age 20-24 Correlation Summary
| Measurement | Immigrants from Northern Africa | Immigrants from Southern Europe |
| Minimum | 42.9% | 44.1% |
| Maximum | 100.0% | 100.0% |
| Range | 57.1% | 55.9% |
| Mean | 74.7% | 77.0% |
| Median | 75.4% | 75.1% |
| Interquartile 25% (IQ1) | 69.0% | 72.2% |
| Interquartile 75% (IQ3) | 78.8% | 81.5% |
| Interquartile Range (IQR) | 9.8% | 9.3% |
| Standard Deviation (Sample) | 11.7% | 11.6% |
| Standard Deviation (Population) | 11.6% | 11.4% |
Demographics Similar to Immigrants from Northern Africa and Immigrants from Southern Europe by In Labor Force | Age 20-24
In terms of in labor force | age 20-24, the demographic groups most similar to Immigrants from Northern Africa are Immigrants from Italy (74.6%, a difference of 0.010%), Inupiat (74.6%, a difference of 0.010%), Sioux (74.6%, a difference of 0.010%), Albanian (74.6%, a difference of 0.040%), and Moroccan (74.7%, a difference of 0.060%). Similarly, the demographic groups most similar to Immigrants from Southern Europe are Creek (74.5%, a difference of 0.0%), Peruvian (74.5%, a difference of 0.0%), Immigrants from Ghana (74.5%, a difference of 0.020%), Immigrants from Kuwait (74.5%, a difference of 0.020%), and Chilean (74.5%, a difference of 0.020%).
| Demographics | Rating | Rank | In Labor Force | Age 20-24 |
| Immigrants | Nigeria | 24.2 /100 | #198 | Fair 74.7% |
| Taiwanese | 23.2 /100 | #199 | Fair 74.7% |
| Nigerians | 21.9 /100 | #200 | Fair 74.7% |
| Choctaw | 21.4 /100 | #201 | Fair 74.7% |
| Moroccans | 20.4 /100 | #202 | Fair 74.7% |
| Immigrants | Northern Africa | 17.9 /100 | #203 | Poor 74.6% |
| Immigrants | Italy | 17.6 /100 | #204 | Poor 74.6% |
| Inupiat | 17.6 /100 | #205 | Poor 74.6% |
| Sioux | 17.5 /100 | #206 | Poor 74.6% |
| Albanians | 16.2 /100 | #207 | Poor 74.6% |
| Immigrants | Uruguay | 15.8 /100 | #208 | Poor 74.6% |
| Arabs | 15.8 /100 | #209 | Poor 74.6% |
| Uruguayans | 15.1 /100 | #210 | Poor 74.6% |
| Immigrants | Australia | 14.7 /100 | #211 | Poor 74.6% |
| Creek | 13.3 /100 | #212 | Poor 74.5% |
| Peruvians | 13.3 /100 | #213 | Poor 74.5% |
| Immigrants | Southern Europe | 13.2 /100 | #214 | Poor 74.5% |
| Immigrants | Ghana | 12.7 /100 | #215 | Poor 74.5% |
| Immigrants | Kuwait | 12.7 /100 | #216 | Poor 74.5% |
| Chileans | 12.5 /100 | #217 | Poor 74.5% |
| Immigrants | Peru | 10.6 /100 | #218 | Poor 74.5% |