Immigrants from Moldova vs Hawaiian In Labor Force | Age 30-34
COMPARE
Immigrants from Moldova
Hawaiian
In Labor Force | Age 30-34
In Labor Force | Age 30-34 Comparison
Immigrants from Moldova
Hawaiians
85.3%
IN LABOR FORCE | AGE 30-34
97.9/ 100
METRIC RATING
91st/ 347
METRIC RANK
83.0%
IN LABOR FORCE | AGE 30-34
0.0/ 100
METRIC RATING
289th/ 347
METRIC RANK
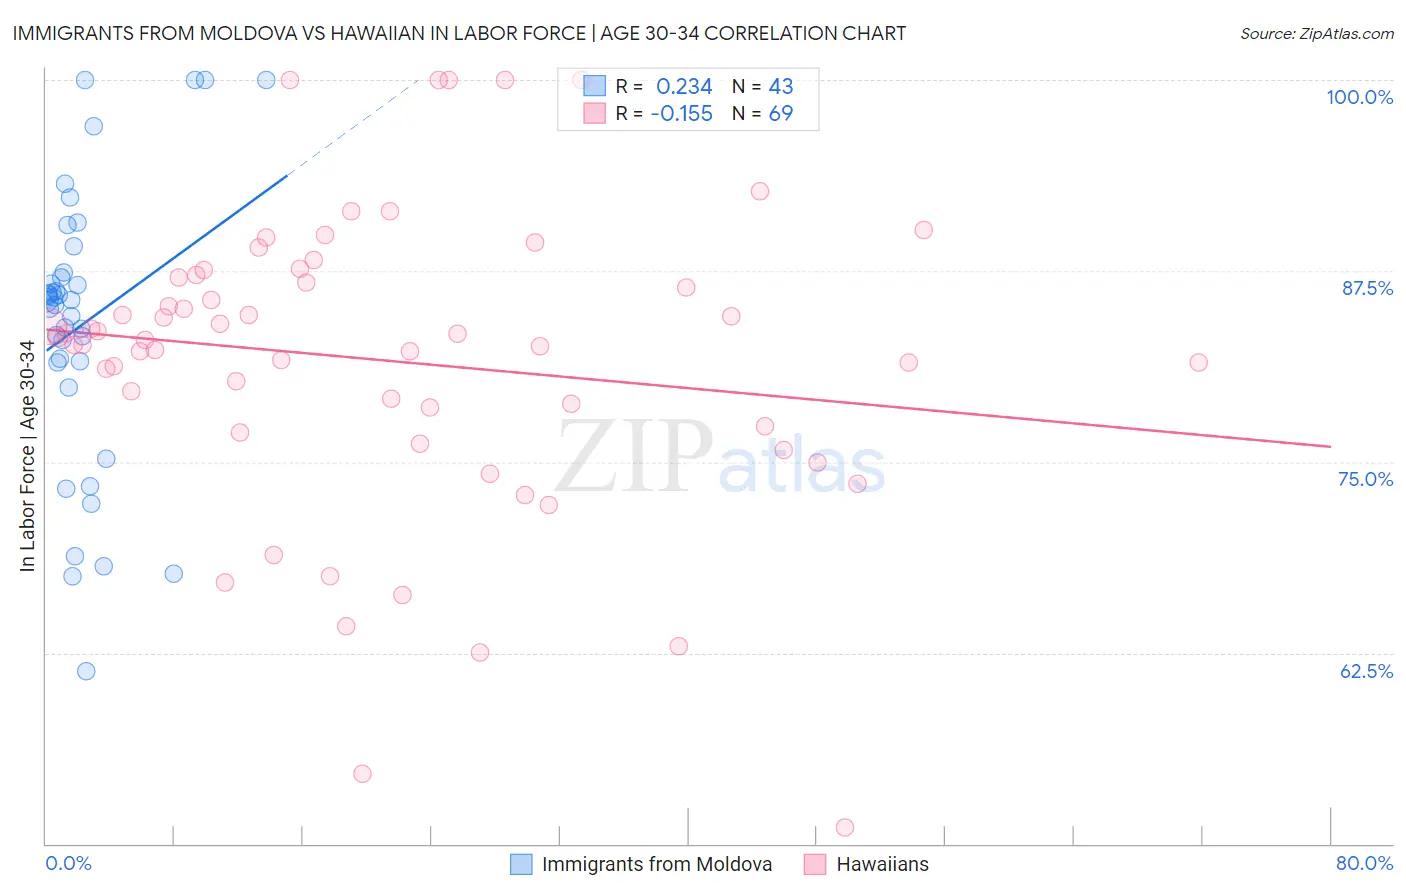
Immigrants from Moldova vs Hawaiian In Labor Force | Age 30-34 Correlation Chart
The statistical analysis conducted on geographies consisting of 124,394,120 people shows a weak positive correlation between the proportion of Immigrants from Moldova and labor force participation rate among population between the ages 30 and 34 in the United States with a correlation coefficient (R) of 0.234 and weighted average of 85.3%. Similarly, the statistical analysis conducted on geographies consisting of 327,455,598 people shows a poor negative correlation between the proportion of Hawaiians and labor force participation rate among population between the ages 30 and 34 in the United States with a correlation coefficient (R) of -0.155 and weighted average of 83.0%, a difference of 2.7%.
In Labor Force | Age 30-34 Correlation Summary
| Measurement | Immigrants from Moldova | Hawaiian |
| Minimum | 61.3% | 51.1% |
| Maximum | 100.0% | 100.0% |
| Range | 38.7% | 48.9% |
| Mean | 84.0% | 81.7% |
| Median | 85.6% | 83.0% |
| Interquartile 25% (IQ1) | 81.5% | 77.2% |
| Interquartile 75% (IQ3) | 87.4% | 87.1% |
| Interquartile Range (IQR) | 5.8% | 10.0% |
| Standard Deviation (Sample) | 9.2% | 9.9% |
| Standard Deviation (Population) | 9.1% | 9.8% |
Similar Demographics by In Labor Force | Age 30-34
Demographics Similar to Immigrants from Moldova by In Labor Force | Age 30-34
In terms of in labor force | age 30-34, the demographic groups most similar to Immigrants from Moldova are Burmese (85.3%, a difference of 0.010%), German Russian (85.2%, a difference of 0.010%), Immigrants from Kazakhstan (85.3%, a difference of 0.020%), Immigrants from Norway (85.2%, a difference of 0.020%), and Immigrants from Northern Europe (85.3%, a difference of 0.030%).
| Demographics | Rating | Rank | In Labor Force | Age 30-34 |
| Greeks | 98.6 /100 | #84 | Exceptional 85.3% |
| Mongolians | 98.5 /100 | #85 | Exceptional 85.3% |
| Immigrants | Taiwan | 98.3 /100 | #86 | Exceptional 85.3% |
| Immigrants | Northern Europe | 98.2 /100 | #87 | Exceptional 85.3% |
| Immigrants | Belgium | 98.2 /100 | #88 | Exceptional 85.3% |
| Immigrants | Kazakhstan | 98.1 /100 | #89 | Exceptional 85.3% |
| Burmese | 97.9 /100 | #90 | Exceptional 85.3% |
| Immigrants | Moldova | 97.9 /100 | #91 | Exceptional 85.3% |
| German Russians | 97.7 /100 | #92 | Exceptional 85.2% |
| Immigrants | Norway | 97.6 /100 | #93 | Exceptional 85.2% |
| Swedes | 97.5 /100 | #94 | Exceptional 85.2% |
| Immigrants | India | 97.4 /100 | #95 | Exceptional 85.2% |
| Immigrants | Korea | 97.3 /100 | #96 | Exceptional 85.2% |
| Thais | 97.2 /100 | #97 | Exceptional 85.2% |
| Immigrants | Uganda | 97.2 /100 | #98 | Exceptional 85.2% |
Demographics Similar to Hawaiians by In Labor Force | Age 30-34
In terms of in labor force | age 30-34, the demographic groups most similar to Hawaiians are Central American Indian (83.0%, a difference of 0.020%), Native Hawaiian (83.0%, a difference of 0.050%), Immigrants from Latin America (83.1%, a difference of 0.15%), Immigrants from Belize (83.2%, a difference of 0.21%), and Cree (83.2%, a difference of 0.21%).
| Demographics | Rating | Rank | In Labor Force | Age 30-34 |
| Mexican American Indians | 0.0 /100 | #282 | Tragic 83.2% |
| Assyrians/Chaldeans/Syriacs | 0.0 /100 | #283 | Tragic 83.2% |
| Immigrants | Belize | 0.0 /100 | #284 | Tragic 83.2% |
| Cree | 0.0 /100 | #285 | Tragic 83.2% |
| Immigrants | Latin America | 0.0 /100 | #286 | Tragic 83.1% |
| Native Hawaiians | 0.0 /100 | #287 | Tragic 83.0% |
| Central American Indians | 0.0 /100 | #288 | Tragic 83.0% |
| Hawaiians | 0.0 /100 | #289 | Tragic 83.0% |
| Blackfeet | 0.0 /100 | #290 | Tragic 82.8% |
| Potawatomi | 0.0 /100 | #291 | Tragic 82.8% |
| Blacks/African Americans | 0.0 /100 | #292 | Tragic 82.8% |
| Nepalese | 0.0 /100 | #293 | Tragic 82.7% |
| Americans | 0.0 /100 | #294 | Tragic 82.7% |
| Pennsylvania Germans | 0.0 /100 | #295 | Tragic 82.6% |
| Chippewa | 0.0 /100 | #296 | Tragic 82.6% |