Immigrants from Micronesia vs Sudanese In Labor Force | Age 20-24
COMPARE
Immigrants from Micronesia
Sudanese
In Labor Force | Age 20-24
In Labor Force | Age 20-24 Comparison
Immigrants from Micronesia
Sudanese
77.8%
IN LABOR FORCE | AGE 20-24
100.0/ 100
METRIC RATING
27th/ 347
METRIC RANK
78.4%
IN LABOR FORCE | AGE 20-24
100.0/ 100
METRIC RATING
15th/ 347
METRIC RANK
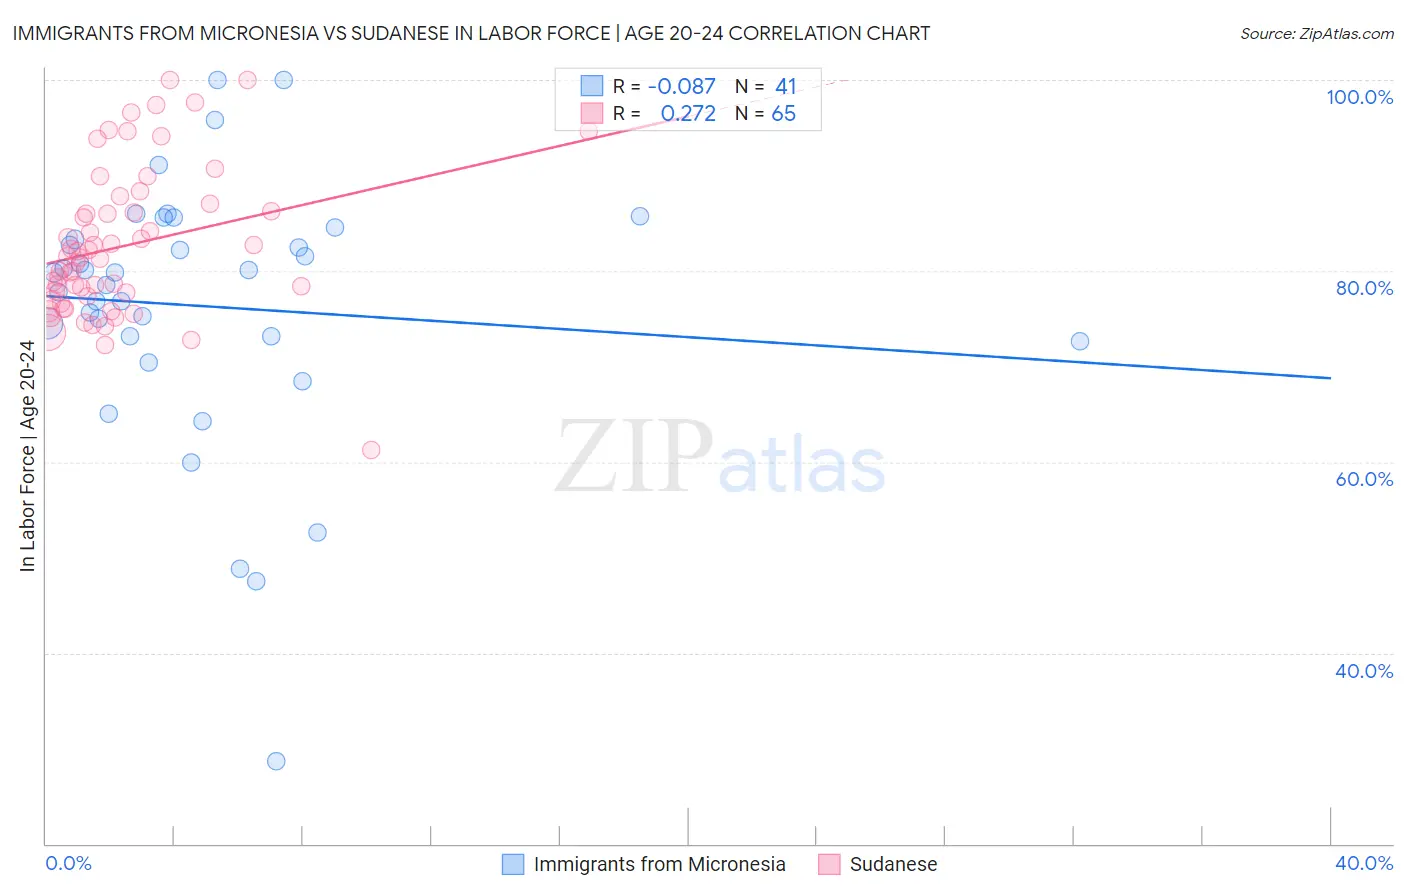
Immigrants from Micronesia vs Sudanese In Labor Force | Age 20-24 Correlation Chart
The statistical analysis conducted on geographies consisting of 61,601,433 people shows a slight negative correlation between the proportion of Immigrants from Micronesia and labor force participation rate among population between the ages 20 and 24 in the United States with a correlation coefficient (R) of -0.087 and weighted average of 77.8%. Similarly, the statistical analysis conducted on geographies consisting of 110,139,890 people shows a weak positive correlation between the proportion of Sudanese and labor force participation rate among population between the ages 20 and 24 in the United States with a correlation coefficient (R) of 0.272 and weighted average of 78.4%, a difference of 0.78%.
In Labor Force | Age 20-24 Correlation Summary
| Measurement | Immigrants from Micronesia | Sudanese |
| Minimum | 28.6% | 61.3% |
| Maximum | 100.0% | 100.0% |
| Range | 71.4% | 38.7% |
| Mean | 76.3% | 82.6% |
| Median | 79.8% | 81.3% |
| Interquartile 25% (IQ1) | 72.9% | 77.1% |
| Interquartile 75% (IQ3) | 84.0% | 86.7% |
| Interquartile Range (IQR) | 11.0% | 9.5% |
| Standard Deviation (Sample) | 13.8% | 7.7% |
| Standard Deviation (Population) | 13.6% | 7.7% |
Demographics Similar to Immigrants from Micronesia and Sudanese by In Labor Force | Age 20-24
In terms of in labor force | age 20-24, the demographic groups most similar to Immigrants from Micronesia are Belgian (77.8%, a difference of 0.040%), Tongan (77.9%, a difference of 0.12%), Slovak (77.7%, a difference of 0.12%), Tlingit-Haida (77.9%, a difference of 0.14%), and Swiss (77.7%, a difference of 0.14%). Similarly, the demographic groups most similar to Sudanese are Dutch (78.4%, a difference of 0.050%), Cape Verdean (78.3%, a difference of 0.090%), Czech (78.5%, a difference of 0.13%), Scandinavian (78.5%, a difference of 0.14%), and German (78.6%, a difference of 0.21%).
| Demographics | Rating | Rank | In Labor Force | Age 20-24 |
| Finns | 100.0 /100 | #11 | Exceptional 78.7% |
| Germans | 100.0 /100 | #12 | Exceptional 78.6% |
| Scandinavians | 100.0 /100 | #13 | Exceptional 78.5% |
| Czechs | 100.0 /100 | #14 | Exceptional 78.5% |
| Sudanese | 100.0 /100 | #15 | Exceptional 78.4% |
| Dutch | 100.0 /100 | #16 | Exceptional 78.4% |
| Cape Verdeans | 100.0 /100 | #17 | Exceptional 78.3% |
| Immigrants | Bosnia and Herzegovina | 100.0 /100 | #18 | Exceptional 78.1% |
| Bangladeshis | 100.0 /100 | #19 | Exceptional 78.1% |
| French Canadians | 100.0 /100 | #20 | Exceptional 78.1% |
| Puget Sound Salish | 100.0 /100 | #21 | Exceptional 78.0% |
| Pennsylvania Germans | 100.0 /100 | #22 | Exceptional 78.0% |
| Yugoslavians | 100.0 /100 | #23 | Exceptional 78.0% |
| Liberians | 100.0 /100 | #24 | Exceptional 78.0% |
| Tlingit-Haida | 100.0 /100 | #25 | Exceptional 77.9% |
| Tongans | 100.0 /100 | #26 | Exceptional 77.9% |
| Immigrants | Micronesia | 100.0 /100 | #27 | Exceptional 77.8% |
| Belgians | 100.0 /100 | #28 | Exceptional 77.8% |
| Slovaks | 100.0 /100 | #29 | Exceptional 77.7% |
| Swiss | 100.0 /100 | #30 | Exceptional 77.7% |
| Poles | 100.0 /100 | #31 | Exceptional 77.6% |