Immigrants from Kazakhstan vs Immigrants from El Salvador In Labor Force | Age 20-64
COMPARE
Immigrants from Kazakhstan
Immigrants from El Salvador
In Labor Force | Age 20-64
In Labor Force | Age 20-64 Comparison
Immigrants from Kazakhstan
Immigrants from El Salvador
79.7%
IN LABOR FORCE | AGE 20-64
69.5/ 100
METRIC RATING
153rd/ 347
METRIC RANK
79.4%
IN LABOR FORCE | AGE 20-64
30.9/ 100
METRIC RATING
189th/ 347
METRIC RANK
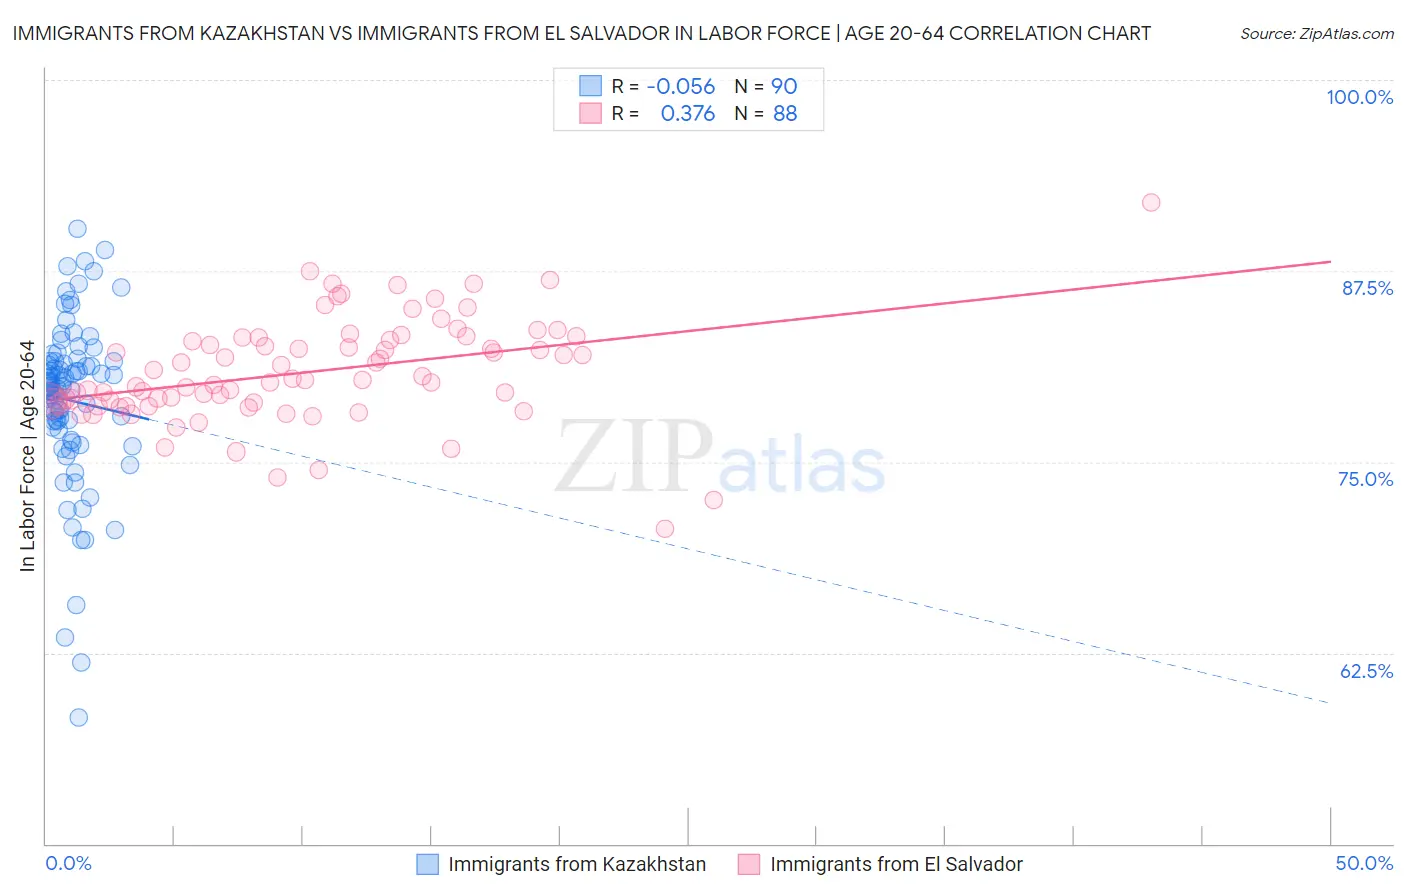
Immigrants from Kazakhstan vs Immigrants from El Salvador In Labor Force | Age 20-64 Correlation Chart
The statistical analysis conducted on geographies consisting of 124,438,593 people shows a slight negative correlation between the proportion of Immigrants from Kazakhstan and labor force participation rate among population between the ages 20 and 64 in the United States with a correlation coefficient (R) of -0.056 and weighted average of 79.7%. Similarly, the statistical analysis conducted on geographies consisting of 357,792,299 people shows a mild positive correlation between the proportion of Immigrants from El Salvador and labor force participation rate among population between the ages 20 and 64 in the United States with a correlation coefficient (R) of 0.376 and weighted average of 79.4%, a difference of 0.33%.
In Labor Force | Age 20-64 Correlation Summary
| Measurement | Immigrants from Kazakhstan | Immigrants from El Salvador |
| Minimum | 58.3% | 70.6% |
| Maximum | 90.3% | 92.0% |
| Range | 32.0% | 21.4% |
| Mean | 79.0% | 80.9% |
| Median | 80.0% | 80.4% |
| Interquartile 25% (IQ1) | 77.1% | 78.8% |
| Interquartile 75% (IQ3) | 81.6% | 83.0% |
| Interquartile Range (IQR) | 4.5% | 4.2% |
| Standard Deviation (Sample) | 5.6% | 3.4% |
| Standard Deviation (Population) | 5.5% | 3.4% |
Similar Demographics by In Labor Force | Age 20-64
Demographics Similar to Immigrants from Kazakhstan by In Labor Force | Age 20-64
In terms of in labor force | age 20-64, the demographic groups most similar to Immigrants from Kazakhstan are New Zealander (79.7%, a difference of 0.0%), Immigrants from South Africa (79.7%, a difference of 0.0%), Senegalese (79.7%, a difference of 0.0%), Immigrants from China (79.7%, a difference of 0.0%), and Scandinavian (79.7%, a difference of 0.020%).
| Demographics | Rating | Rank | In Labor Force | Age 20-64 |
| Immigrants | Southern Europe | 78.9 /100 | #146 | Good 79.8% |
| Immigrants | Philippines | 78.0 /100 | #147 | Good 79.8% |
| Romanians | 77.6 /100 | #148 | Good 79.8% |
| Icelanders | 75.1 /100 | #149 | Good 79.7% |
| Costa Ricans | 72.4 /100 | #150 | Good 79.7% |
| Scandinavians | 72.0 /100 | #151 | Good 79.7% |
| Immigrants | Northern Europe | 72.0 /100 | #152 | Good 79.7% |
| Immigrants | Kazakhstan | 69.5 /100 | #153 | Good 79.7% |
| New Zealanders | 69.4 /100 | #154 | Good 79.7% |
| Immigrants | South Africa | 69.2 /100 | #155 | Good 79.7% |
| Senegalese | 69.1 /100 | #156 | Good 79.7% |
| Immigrants | China | 69.1 /100 | #157 | Good 79.7% |
| Austrians | 67.6 /100 | #158 | Good 79.7% |
| Immigrants | Cuba | 66.7 /100 | #159 | Good 79.7% |
| Moroccans | 66.7 /100 | #160 | Good 79.7% |
Demographics Similar to Immigrants from El Salvador by In Labor Force | Age 20-64
In terms of in labor force | age 20-64, the demographic groups most similar to Immigrants from El Salvador are Immigrants from Syria (79.4%, a difference of 0.0%), Immigrants from Haiti (79.4%, a difference of 0.010%), Assyrian/Chaldean/Syriac (79.4%, a difference of 0.020%), Swiss (79.4%, a difference of 0.020%), and Northern European (79.5%, a difference of 0.030%).
| Demographics | Rating | Rank | In Labor Force | Age 20-64 |
| Malaysians | 37.1 /100 | #182 | Fair 79.5% |
| Immigrants | Hungary | 36.8 /100 | #183 | Fair 79.5% |
| Finns | 35.9 /100 | #184 | Fair 79.5% |
| Israelis | 34.7 /100 | #185 | Fair 79.5% |
| Northern Europeans | 34.5 /100 | #186 | Fair 79.5% |
| Assyrians/Chaldeans/Syriacs | 33.3 /100 | #187 | Fair 79.4% |
| Immigrants | Haiti | 32.1 /100 | #188 | Fair 79.4% |
| Immigrants | El Salvador | 30.9 /100 | #189 | Fair 79.4% |
| Immigrants | Syria | 30.8 /100 | #190 | Fair 79.4% |
| Swiss | 28.9 /100 | #191 | Fair 79.4% |
| Immigrants | Denmark | 26.9 /100 | #192 | Fair 79.4% |
| Indonesians | 26.1 /100 | #193 | Fair 79.4% |
| Immigrants | Thailand | 24.8 /100 | #194 | Fair 79.4% |
| Immigrants | Austria | 23.7 /100 | #195 | Fair 79.4% |
| Ecuadorians | 23.1 /100 | #196 | Fair 79.4% |